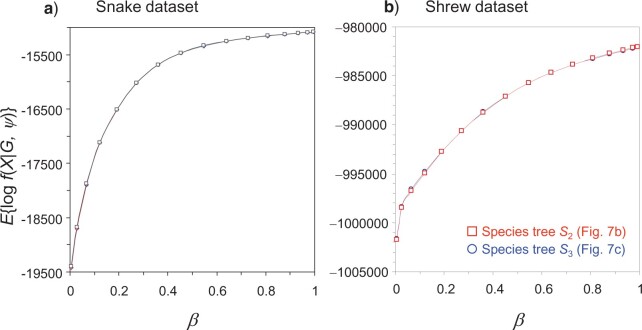
Figure 7.
Calculation of the marginal likelihood for fixed species trees. The average log
likelihood over the MCMC sample from the power posterior is plotted against the
given  for each fixed species tree. In
a) the 3 alternative species trees for the rattlesnake dataset are compared: MB-S
(which is the MAP tree), MS-B, and BS-M (Fig.
6). The three curves are indistinguishable. In b), the 2 curves are for the
species trees
  and
and  of
Philippine shrews for the UCE dataset (Fig.
8).

