Figure 2.

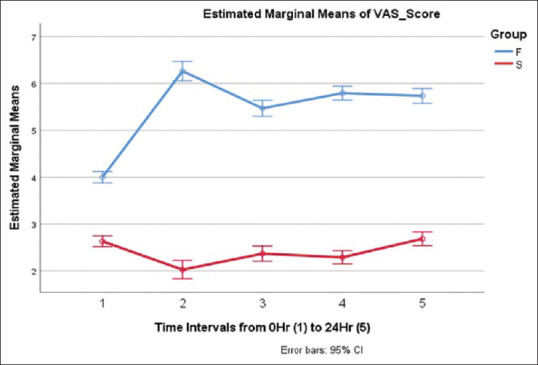
Shows comparison of VAS score for 1st 24 hrs in both groups. The figure is of a comparative line graph of means + 95% confidence interval in every 6 hrs

Shows comparison of VAS score for 1st 24 hrs in both groups. The figure is of a comparative line graph of means + 95% confidence interval in every 6 hrs