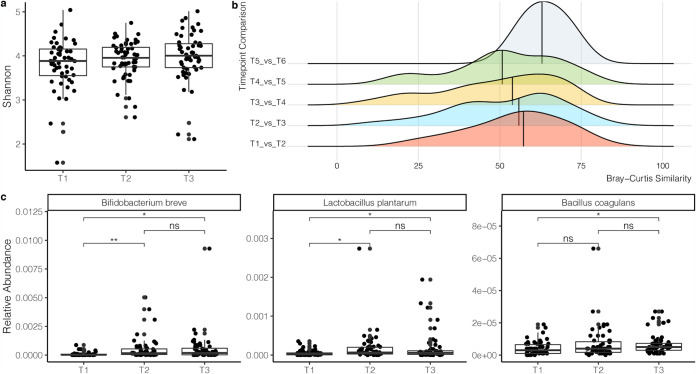
FIG 3.
Longitudinal microbiome diversity and relative abundances of probiotics in subjects with IBS. (a) Shannon index of the microbiome composition from subjects with time points 1 to 3. (b) Bray-Curtis similarity of time points within each individual. Each time point is compared to each subsequent time point. (c) Relative abundances of probiotic species detected in the gut microbiome of subjects across 3 time points. t tests were computed with false-discovery rate (FDR)-adjusted P values. *, P value < 0.05; **, P value < 0.01; ****, P value < 0.0001; ns, not significant.

