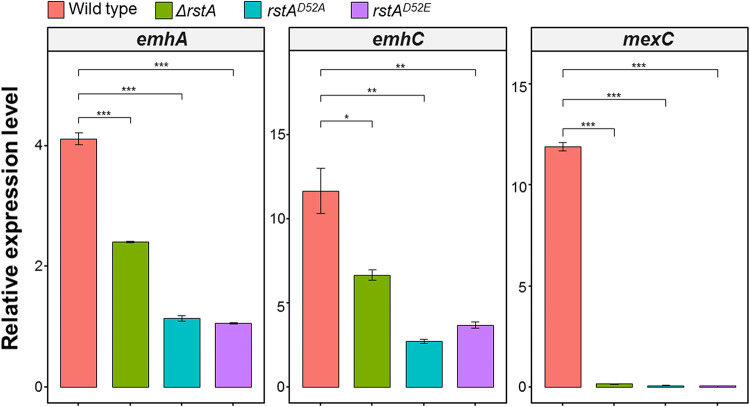
FIG 4.
The qRT-PCR assays were employed to monitor the transcription levels of emhA, emhC, and mexC in different strains. The expression level of 16S was used for normalization and 2-ΔCt method was used for data analysis. Error bars denote standard deviation (n = 3). P less than 0.001 was displayed as ***, P less than 0.01 was displayed as **, P less than 0.05 was displayed as *.

