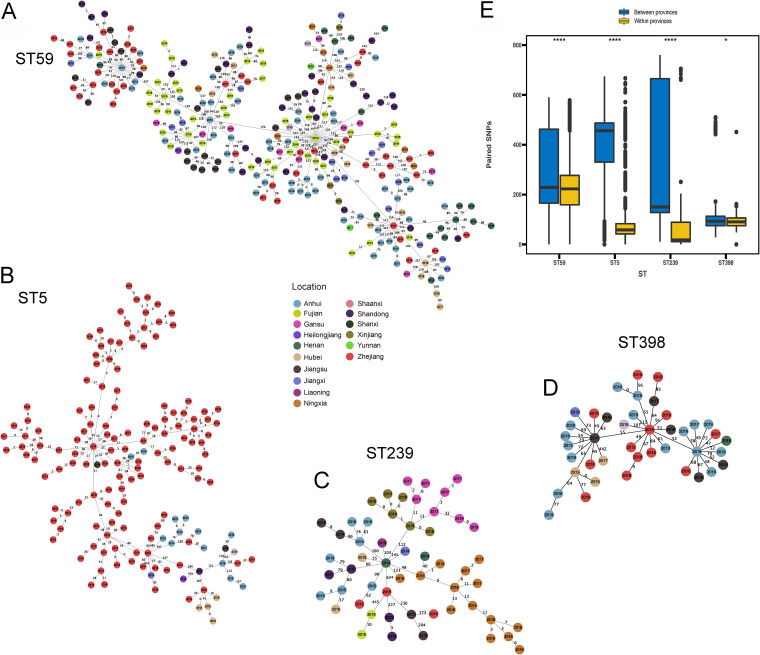
FIG 5.
SNP distribution of the major STs. (A to D) MSTs of ST59, ST5, ST239, and ST398 MRSA strains based on core-SNP with MLST grouping. The different locations are distinguished by circle color. The SNP differences of each STs were shown on the connecting lines. (E) Paired SNPs among ST59, ST239, ST5, and ST398 MRSA isolates. *, P < 0.05; ****, P < 0.0001.

