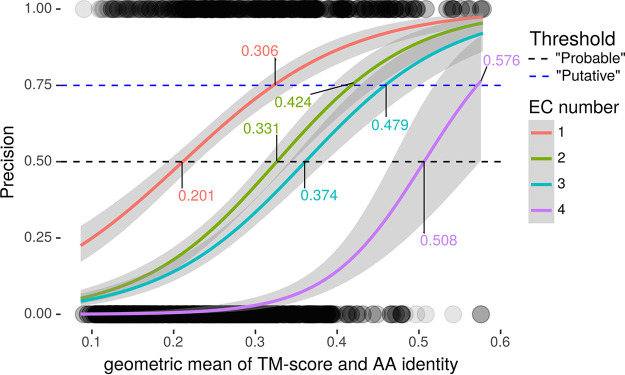
FIG 1.
Determining similarity thresholds for annotation inclusion criteria. Precision of EC number as regressed against the geometric mean of TM-score and AA% (μgeom) for each specificity tier. Horizontal lines define (50% and 75%) thresholds, the points where precision intersects with regression lines for each EC specificity curve (labeled). Circles at the bottom and top are individual data points (incorrect = 0 and correct = 1; y axis, precision; x axis, μgeom). Circles are rendered at 10% opacity to visualize observation density. Only templates with AA% of <40% were included.

