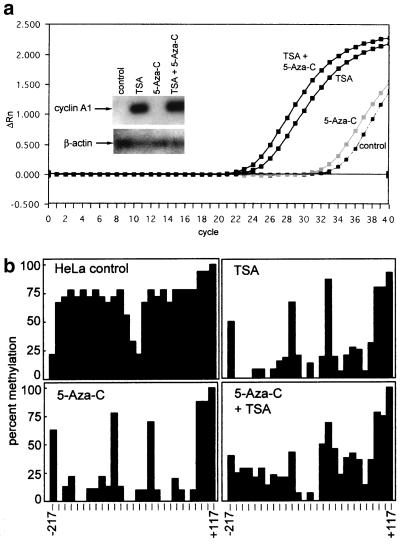
FIG. 5.
(a) Induction of endogenous cyclin A1 expression by TSA. Induction of cyclin A1 gene expression by 5-aza-C and TSA was analyzed by quantitative real-time PCR as well as by conventional RT-PCR followed by hybridization. The plot for the amplification of cyclin A1 cDNA from HeLa cells that were exposed to the indicated drugs is shown. The x axis shows the cycle number, and the y axis shows the changes in fluorescence compared to baseline values. These samples contained similar amounts of cDNA, as demonstrated by analysis of GAPDH expression (not shown). The inset shows conventional RT-PCR for cyclin A1 (28 cycles) and β-actin (20 cycles). PCR was followed by Southern blotting and nonradioactive detection with an internal oligonucleotide. TSA, but not 5-aza-C, led to a strong induction of cyclin A1 in HeLa cells. (b) 5-aza-C and TSA lead to demethylation of the cyclin A1 promoter in HeLa cells. To analyze the effects of 5-aza-C and TSA on the methylation status of the endogenous cyclin A1 promoter in HeLa cells, genomic DNA was prepared, bisulfite treated, PCR amplified, and sequenced (see Materials and Methods). The percentage of methylation at 27 CpG dinucleotides of the cyclin A1 promoter is indicated. Two independent DNA preparations and PCR amplifications were performed and cloned, and at least 10 independent clones were sequenced.

