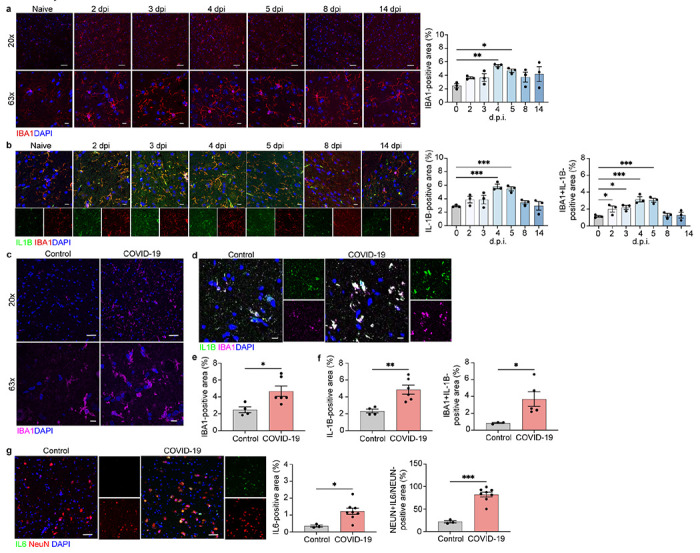
Figure 2.

Microglia and neurons contribute to neuroinflammation in the ION of SARS-CoV-2-infected hamsters and of patients with COVID-19. a Representative image of IBA1 in the hamster ION at naïve, 2, 3, 4, 5, 8, and 14 dpi, showing staining for IBA1 (red) and DAPI (blue) at 20x and 63x and quantified for percent IBA1+ area. b Immunostaining for IL-1β and IBA1 in the hamster ION at naïve, 2, 3, 4, 5, 8, and 14 dpi, presented as microscopy with IBA1 (red), IL-1β (green) and DAPI (blue) and percent IL-1β+ area and IL-1β+IBA1+ area, normalized to total IL-1B+ area. c, e Representative image of IBA1 in control and COVID-19 patient ION, showing staining for IBA1 (magenta) and DAPI (blue) at 20x and 63x and quanti-fied for percent IBA1+ area. d, f Immunostaining for IL-1β and IBA1 in ION of control and COVID-19 patients, presented as microscopy with IBA1 (magenta), IL-1β (green) and DAPI (blue) and percent IL-1β+ area and IL-1β+IBA1+ area, normalized to total IBA1+ area. g. Im-munostaining for IL-6 and NeuN in ION of control and COVID-19 patients, presented as mi-croscopy with NeuN (red), IL-6 (green) and DAPI (blue) and percent IL-6+ area and IL-16+NeuN+ area, normalized to total NeuN+ area. Data were pooled from at least two independent experiments. Scale bars, 20 μm (20x) or 10 μm (63x). Data represent the mean ± s.e.m. and were analysed by two-way ANOVA or Student’s t-test.
