Figure 4.

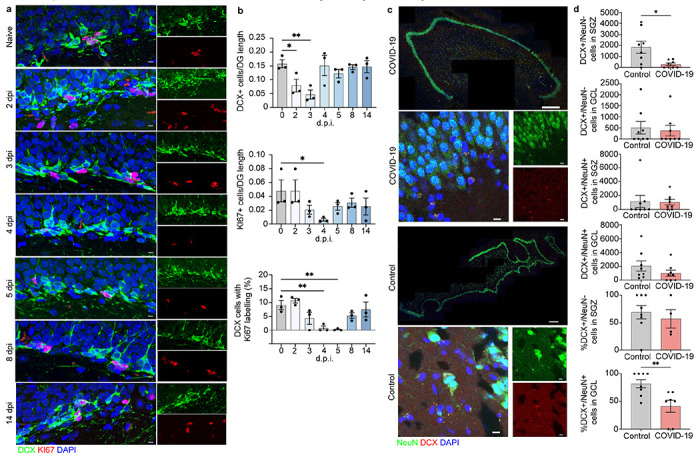
Neuroblast proliferation in the SARS-CoV2 infected hamster and doublecortin (DCX) positive cells and neurons in human hippocampus from COVID-19 patient and non-COVID-19 control. a, b Microscopy of the dentate gyrus of hamsters at naïve, 2, 3, 4, 5, 8, and 14 dpi, showing staining of Ki67 (red), neuroblast (green), and DAPI (blue), followed by quantification of percent Ki67+DCX+ cells, normalized to the total number of DCX+ cells. c. Quantification of percent DCX+Ki67+ area, normalized to total DCX+ area in the rostral migra-tory stream of hamsters at naïve, 2, 3, 4, 5, 8, and 14 dpi. Data were pooled from at least two independent experiments. Scale bars, 50 μm. Data represent the mean ± s.e.m. and were analysed by two-way ANOVA. c. Select images of whole hippocampus & high magnification images sections stained with DAPI (blue), NeuN (green), and DCX (red) from COVID-19 pa-tient and non-COVID-19 control. The granule cell layer (GCL), subgranular zone (SGZ), and molecular layer (ML) of the DG are visible, combined channels imaged at 20X; scale bar is 500 μm. High magnification images were captured at 63x, scale bar is 20 μm. d. In the SGZ, DCX+/NeuN− cells were fewer in COVID-19 patients vs controls (p = 0.026; t(7.794) = 2.731; Welch’s t test for non-stoichiometric data), with no group differences in DCX+/NeuN+ cell number (p = 0.189; Mann-Whitney). In the GCL, neither DCX+/NeuN− cell count (p = 0.846; Mann-Whitney), nor DCX+/NeuN+ cell count (p = 0.378; Mann-Whitney) differs between COVID-19 and control subjects. Percent of DCX+/NeuN− cells located in the SGZ vs the GCL did not differ between control and COVID-19 groups (p = 0.453; Mann-Whitney). Percent of DCX+/NeuN+ cells located in the GCL vs the SGZ was lower in COVID-19 patients vs control subjects (p = 0.009; Mann-Whitney).
