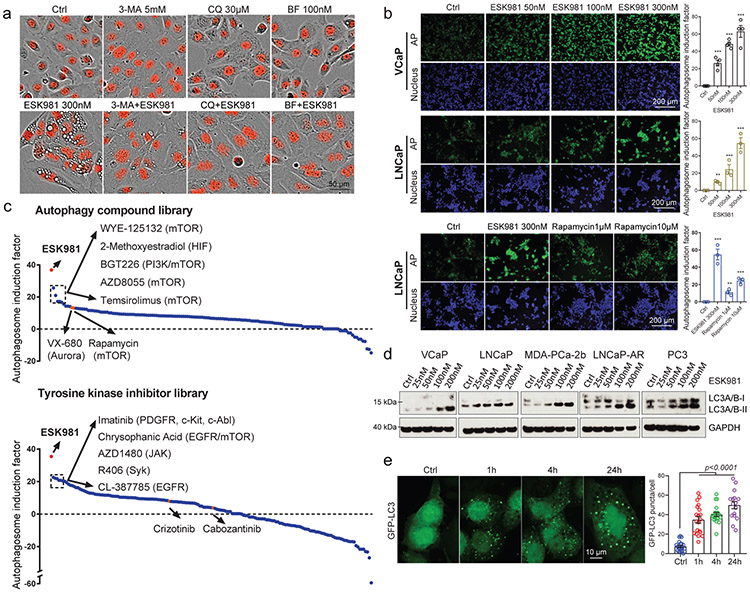
Fig. 3. ESK981 induces accumulation of autophagosomes in prostate cancer cells.
(a) Representative morphologies of DU145-RFP cells from three independent experiments treated with either ESK981, autophagy inhibitors (3-methyladenine [3-MA], chloroquine [CQ], bafilomycin A1 [BF]), or a combination of ESK981 and one additional autophagy inhibitor for six hours. Red indicates nuclei.
(b) VCaP and LNCaP cells were treated with increasing concentrations of ESK981 for 24 hours. Autophagosome induction activity was measured with CYTO-ID®, and the quantification of autophagosomes are shown on the right. Rapamycin served as a positive control for autophagy induction. Data were analyzed by two-tailed unpaired t test from three (LNCaP) and four (VCaP) independent experiments and presented as mean ± SEM. **p<0.01; ***p<0.001.
(c) Autophagosome induction activity of ESK981 (in red), measured with CYTO-ID®, when compared to an autophagy-related compound library consisting of 154 compounds (top) or a tyrosine kinase inhibitor library consisting of 167 compounds (bottom). DU145 cells were treated with ESK981 or the other compounds (all at 300 nM) for 24 hours. The top five compounds and their respective targets are indicated. VX-680 and rapamycin are highlighted in orange in autophagy-related compound library. Crizotinib and cabozantinib are highlighted in orange in tyrosine kinase inhibitor library. Targets of highlighted compounds are indicated in parentheses.
(d) The indicated prostate cancer cell lines were treated with increasing concentrations of ESK981 for 24 hours. LC3 levels were assessed by western blot, with GAPDH serving as a loading control.
(e) Representative images of GFP-LC3 puncta in DU145 cells with 300 nM ESK981 treatment for various times. Quantifications of GFP-LC3 puncta from Ctrl (n=20 analyzed cells), 1h (n=20 analyzed cells), 4h (n=20 analyzed cells), and 24h (n=16 analyzed cells) are shown on the right. Data were analyzed by two-tailed unpaired t test and presented as mean ± SEM. P-value indicated.

