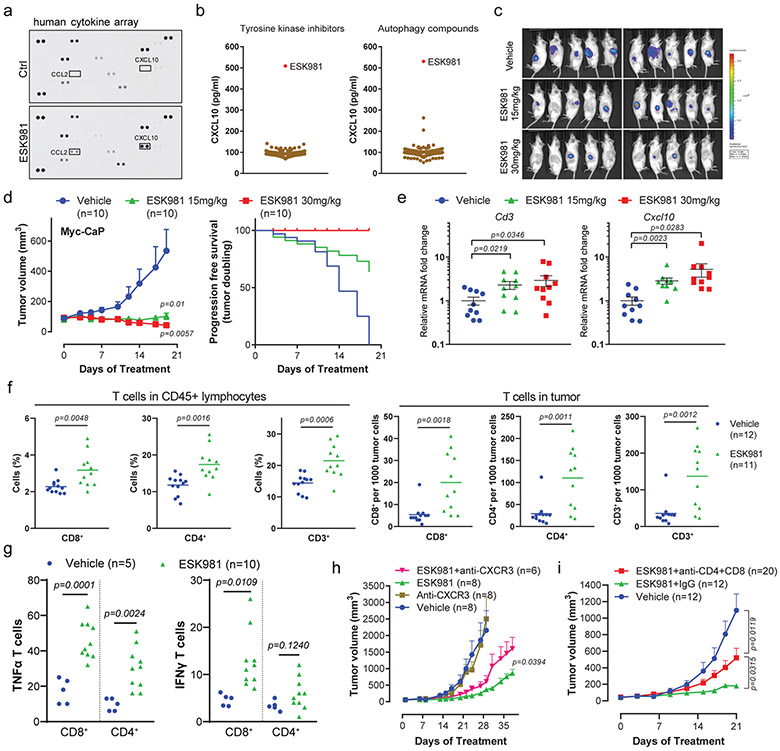
Fig. 5. ESK981 activates an anti-tumor immune response in immune-competent murine prostate cancer models.
(a) Human cytokine array using VCaP conditioned medium after 300 nM ESK981 treatment for 24 hours. CXCL10 and CCL2 are highlighted on the dot plots.
(b) CXCL10 ELISA using conditioned medium from VCaP cells treated with either ESK981 or two compound libraries (tyrosine kinase inhibitors and autophagy-related compounds), all at 300 nM for 24 hours. N=3 replicate wells per compound.
(c) Myc-CaP tumors were established in FVB mice and treated with vehicle or the indicated dose of ESK981. Bioluminescent imaging was performed on individual tumors at day 19. N=10 tumors per group.
(d) Average Myc-CaP tumor volumes from indicated treatment groups (left). Progression-free survival (tumor doubling) was calculated from individual tumors (right). Data were analyzed by two-tailed unpaired t test and presented as mean ± SEM. N=10 tumors per group, and P-values are indicated.
(e) Cd3 and Cxcl10 mRNA levels of individual Myc-CaP tumors treated with vehicle, 15 mg/kg, or 30 mg/kg ESK981. Data were analyzed by two-tailed unpaired t test and presented as mean ± SEM. N=10 tumors per group, and P-values are indicated.
(f) Flow cytometry quantification of CD8+, CD4+, and CD3+ T cells in CD45+ lymphocytes (left) and infiltrating Myc-CaP tumors (right) treated with vehicle or 15 mg/kg ESK981. Data were analyzed by two-tailed unpaired t test and presented as mean and individual data points. N=number of tumors, and P-values are indicated.
(g) Flow cytometry quantification of TNFα or IFNγ-expressing CD8+ and CD4+ T cells infiltrating Myc-CaP tumors treated with vehicle or 15 mg/kg ESK981. Data were analyzed by two-tailed unpaired t test and presented as individual data points. N=number of tumors, and P-values are indicated.
(h) Average Myc-CaP tumor volumes from indicated treatment groups in FVB mice. Data are presented as mean ± SEM and p-values were analyzed by two-tailed unpaired t test at endpoint for ESK981 and ESK981+anti-CXCR3 groups. N=number of tumors, and P-value is indicated.
(i) Average Myc-CaP tumor volumes from indicated treatment groups in FVB mice. Data were analyzed by two-tailed unpaired t test and presented as mean ± SEM. N=number of tumors, and P-values are indicated.

