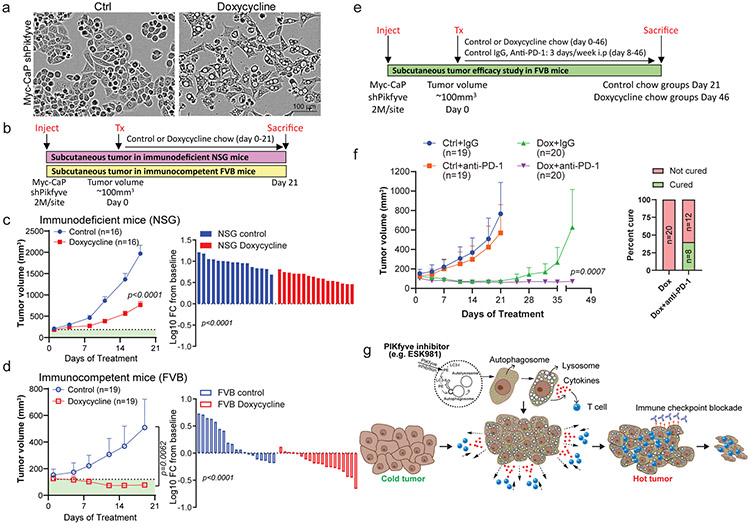
Fig. 8. Genetic inhibition of Pikfyve potentiates the therapeutic benefit of anti-PD-1 immunotherapy in immune-competent murine models.
(a) Representative images of doxycycline inducible shPikfyve Myc-CaP cells with or without 1 μg/ml doxycycline treatment for 72 hours from three independent experiments.
(b) Schematic illustration of shPikfyve Myc-CaP experimental design in immunodeficient mice (NSG) and immunocompetent mice (FVB).
(c) Average tumor volume of shPikfyve Myc-CaP with or without doxycycline chow in NSG mice (left). Percent changes in shPikfyve Myc-CaP tumor volume represented by waterfall plot in NSG mice (right). Data were analyzed by two-tailed unpaired t test and presented as mean ± SEM. N=number of tumors and P-value is indicated.
(d) Average tumor volume of shPikfyve Myc-CaP with or without doxycycline chow in FVB mice (left). Percent changes in shPikfyve Myc-CaP tumor volume represented by waterfall plot in FVB mice (right). Data were analyzed by two-tailed unpaired t test and presented as mean ± SEM. N=number of tumors and P-value is indicated.
(e) Schematic illustration of shPikfyve Myc-CaP experimental design in immunocompetent mice. i.p, intraperitoneal.
(f) Average tumor volume of shPikfyve Myc-CaP with control chow or doxycycline chow and/or mouse control IgG or anti-PD-1 antibody for 6 weeks (left). Data from control chow or doxycycline chow groups were included in Fig. 8d for different comparison purposes. Percentage cure rate defined as ratio of complete tumor regression on groups of doxycycline chow and/or mouse anti-PD-1 antibody (right). Data were analyzed by Mann-Whitney test and presented as mean ± SEM. N=number of tumors and P-value is indicated.
(g) Model of ESK981’s mechanism of action and its anti-tumor activity, described in the main text.

