. 2021 Sep 25;38(3):345–353. doi: 10.5511/plantbiotechnology.21.0727a

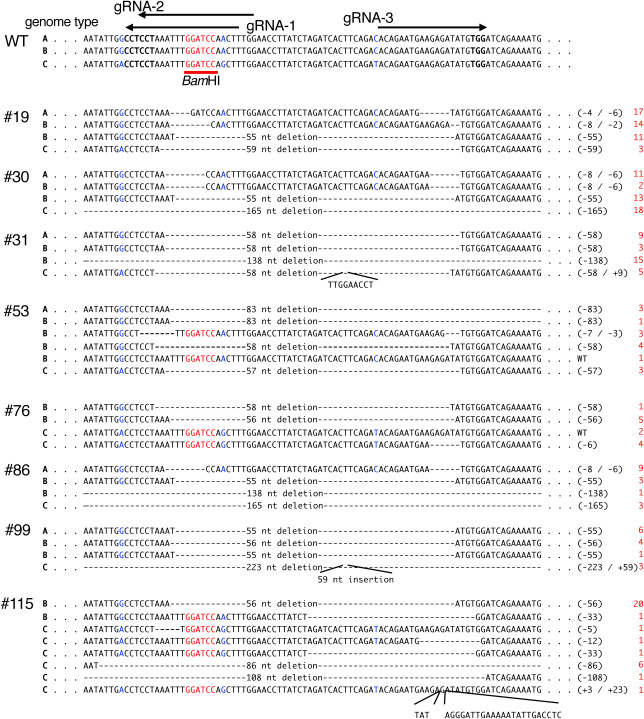
Figure 4. Nucleotide sequences around the target site in the potato SBE3 gene of the representative mutants. The wild-type nucleotide sequence (WT) is shown in the upper panel of the figure. Genome types A, B, and C indicate those from WT-A, WT-B, and WT-C, respectively. Nucleotide sequences containing the outside region are shown in Supplementary Figure S1. The gRNAs (gRNA-1, gRNA-2, and gRNA-3) are indicated above the figure. The region corresponding to the BamHI site is indicated by red letters. Polymorphic nucleotides between three genomes are shown in blue letters. Numbers with the prefix # indicate the individual transformants. Multiple DNA sequences that were detected were aligned. Gaps indicate a nucleotide deletion in the mutants. Nucleotide insertions are indicated in the appended lines. The nucleotide sequences that are indicated by gaps throughout the entire region in #30, #31, #86, #99, and #115 are shown in Supplementary Figure S2. Nucleotide numbers of deletions and insertions are summarized on the right side. Red-colored numbers in the right side showed the frequency of the nucleotide sequences detected.

Figure 4. Nucleotide sequences around the target site in the potato SBE3 gene of the representative mutants. The wild-type nucleotide sequence (WT) is shown in the upper panel of the figure. Genome types A, B, and C indicate those from WT-A, WT-B, and WT-C, respectively. Nucleotide sequences containing the outside region are shown in Supplementary Figure S1. The gRNAs (gRNA-1, gRNA-2, and gRNA-3) are indicated above the figure. The region corresponding to the BamHI site is indicated by red letters. Polymorphic nucleotides between three genomes are shown in blue letters. Numbers with the prefix # indicate the individual transformants. Multiple DNA sequences that were detected were aligned. Gaps indicate a nucleotide deletion in the mutants. Nucleotide insertions are indicated in the appended lines. The nucleotide sequences that are indicated by gaps throughout the entire region in #30, #31, #86, #99, and #115 are shown in Supplementary Figure S2. Nucleotide numbers of deletions and insertions are summarized on the right side. Red-colored numbers in the right side showed the frequency of the nucleotide sequences detected.