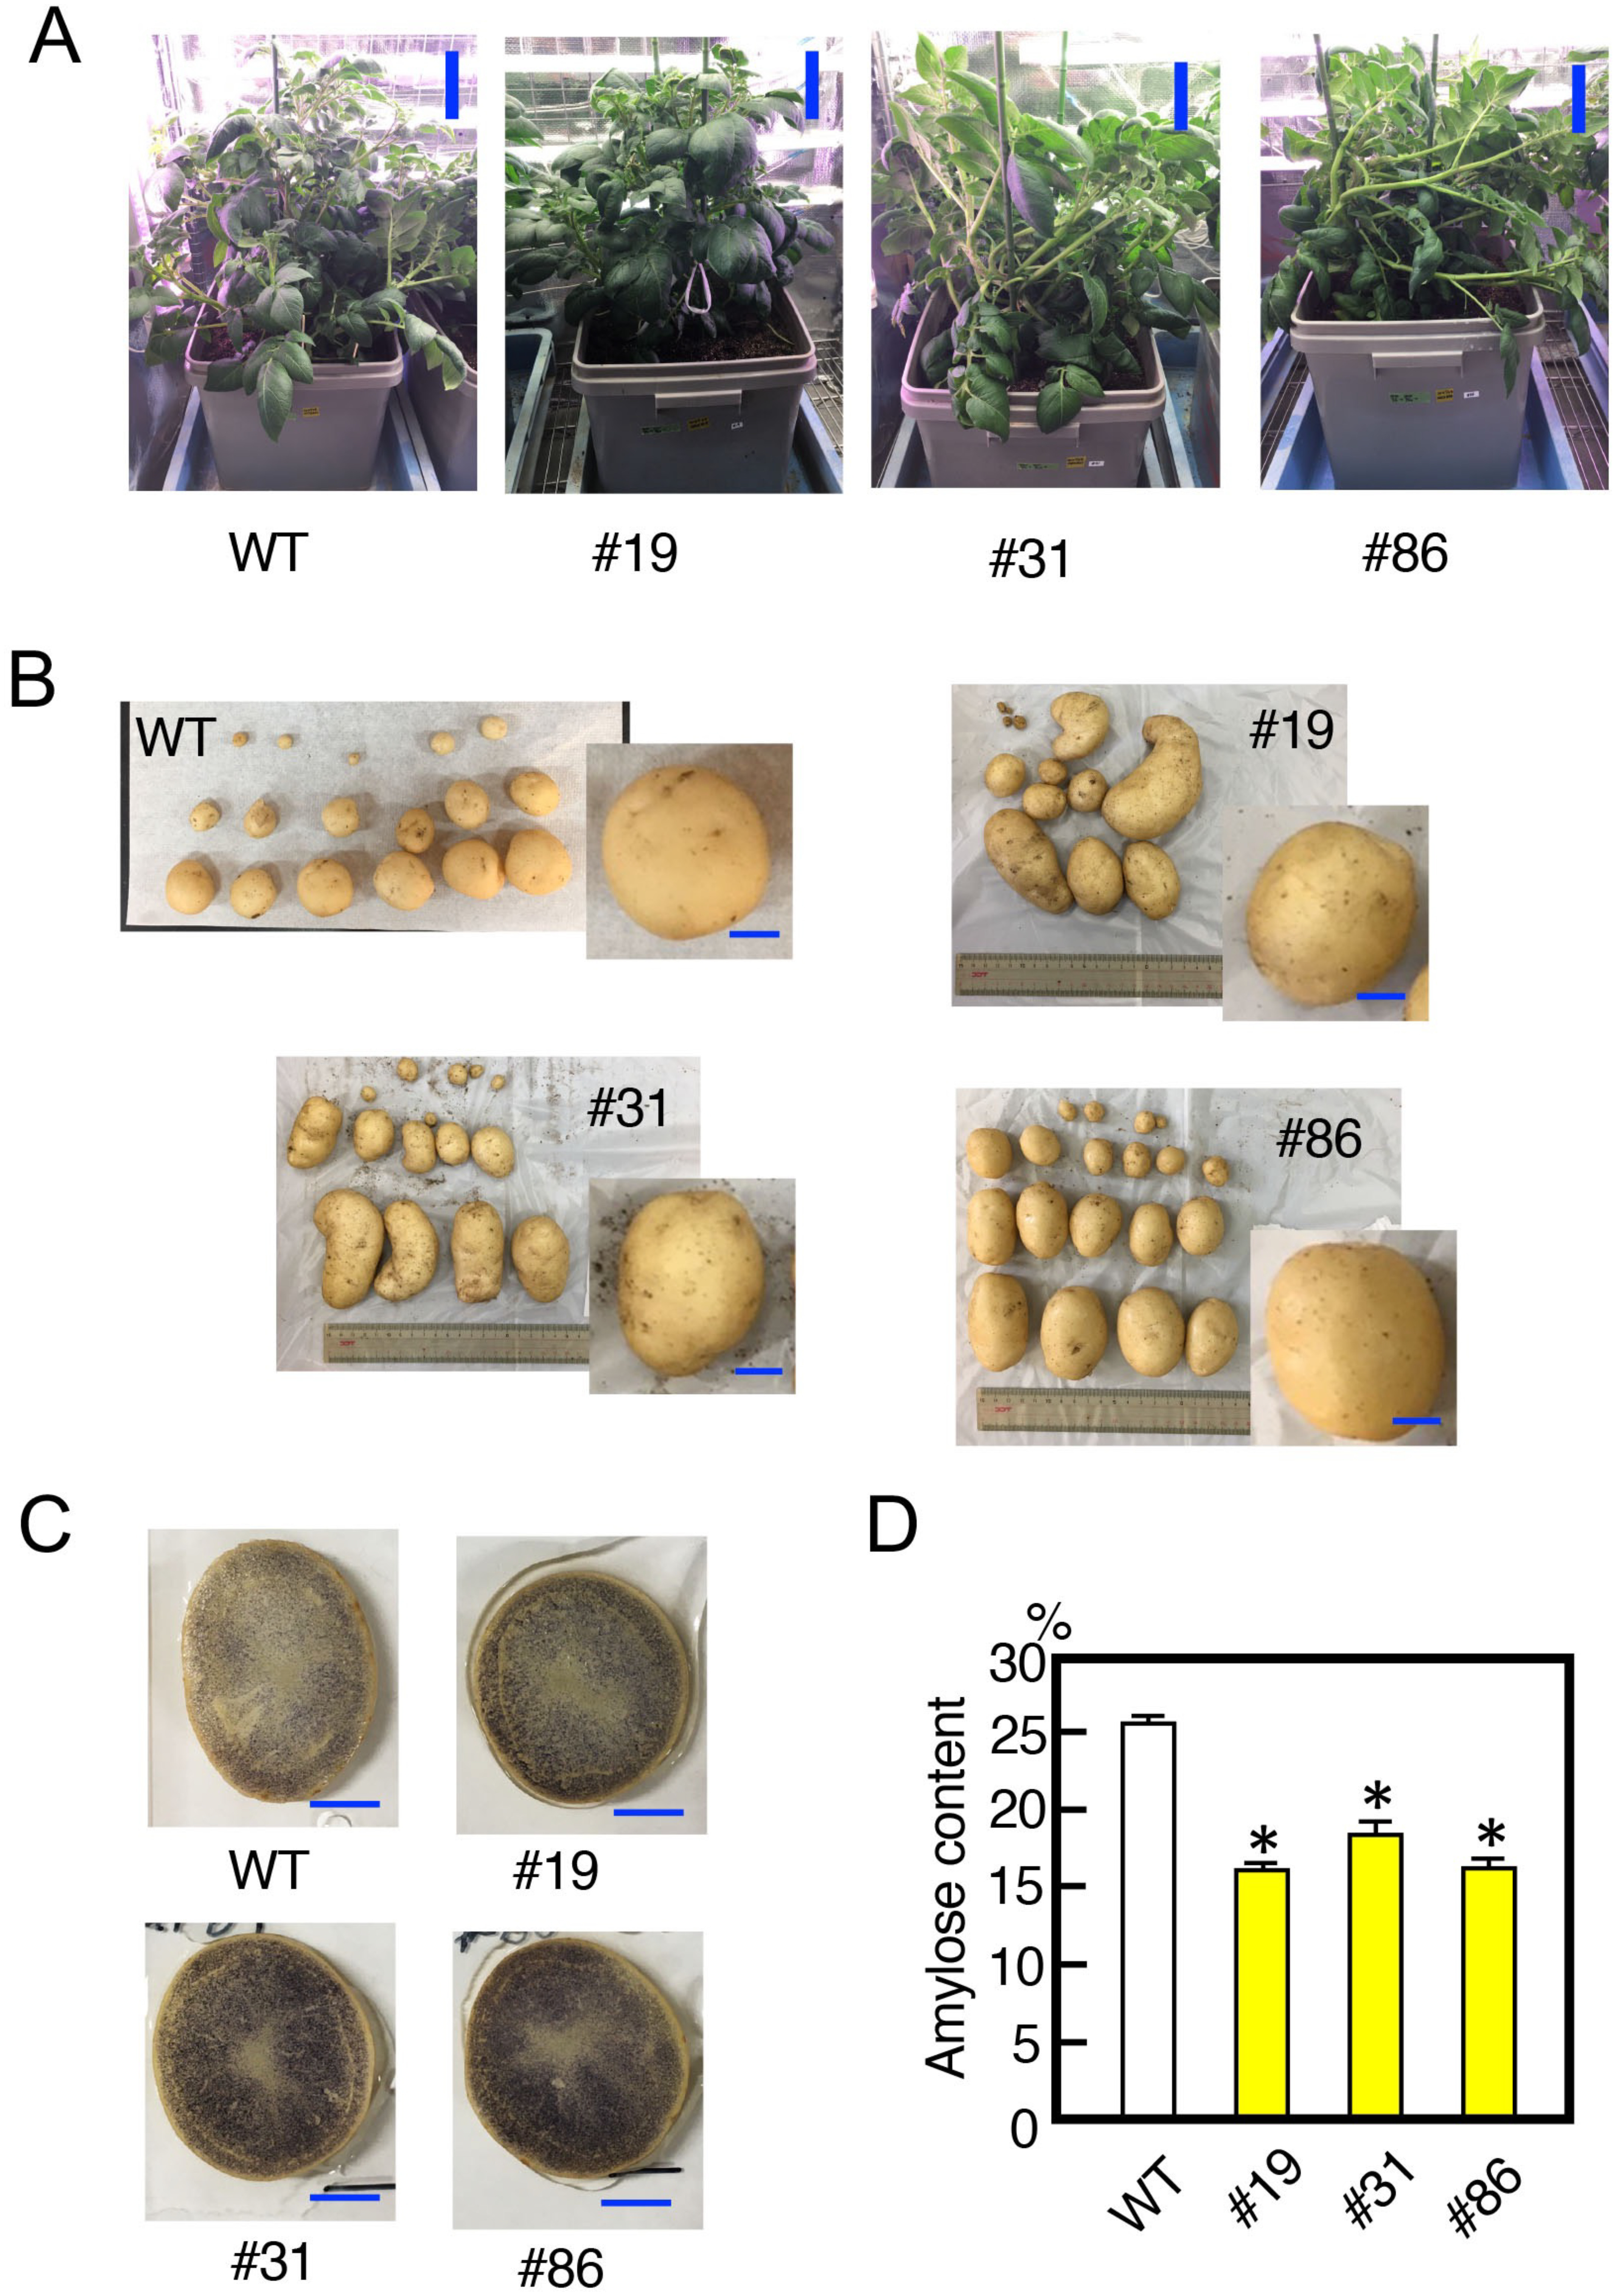
Figure 5. Characteristics of potato SBE3 mutants. (A) Shapes of the sbe3 mutants grown in a greenhouse. Plants were cultured for two months. Numbers with the prefix # indicate the individual transformants. WT, wild-type plant. Bars indicate 20 cm. (B) Shapes of the tubers of the mutant lines. Tubers generated from each mutant line are shown. A representative image is highlighted on the right side of each panel. Bars indicate 2 cm. (C) Iodine staining of potato tuber sections. Images were taken at 1.5 h after staining treatment. Bars indicate 2 cm. (D) Amylose content in tuber starch prepared from sbe3 mutants and wild-type plants. Values show the average of triplicate measurements. Error bars indicate the standard errors (n=3). Asterisks indicate significant differences in the values of transformants compared to that of wild type at p<0.05.