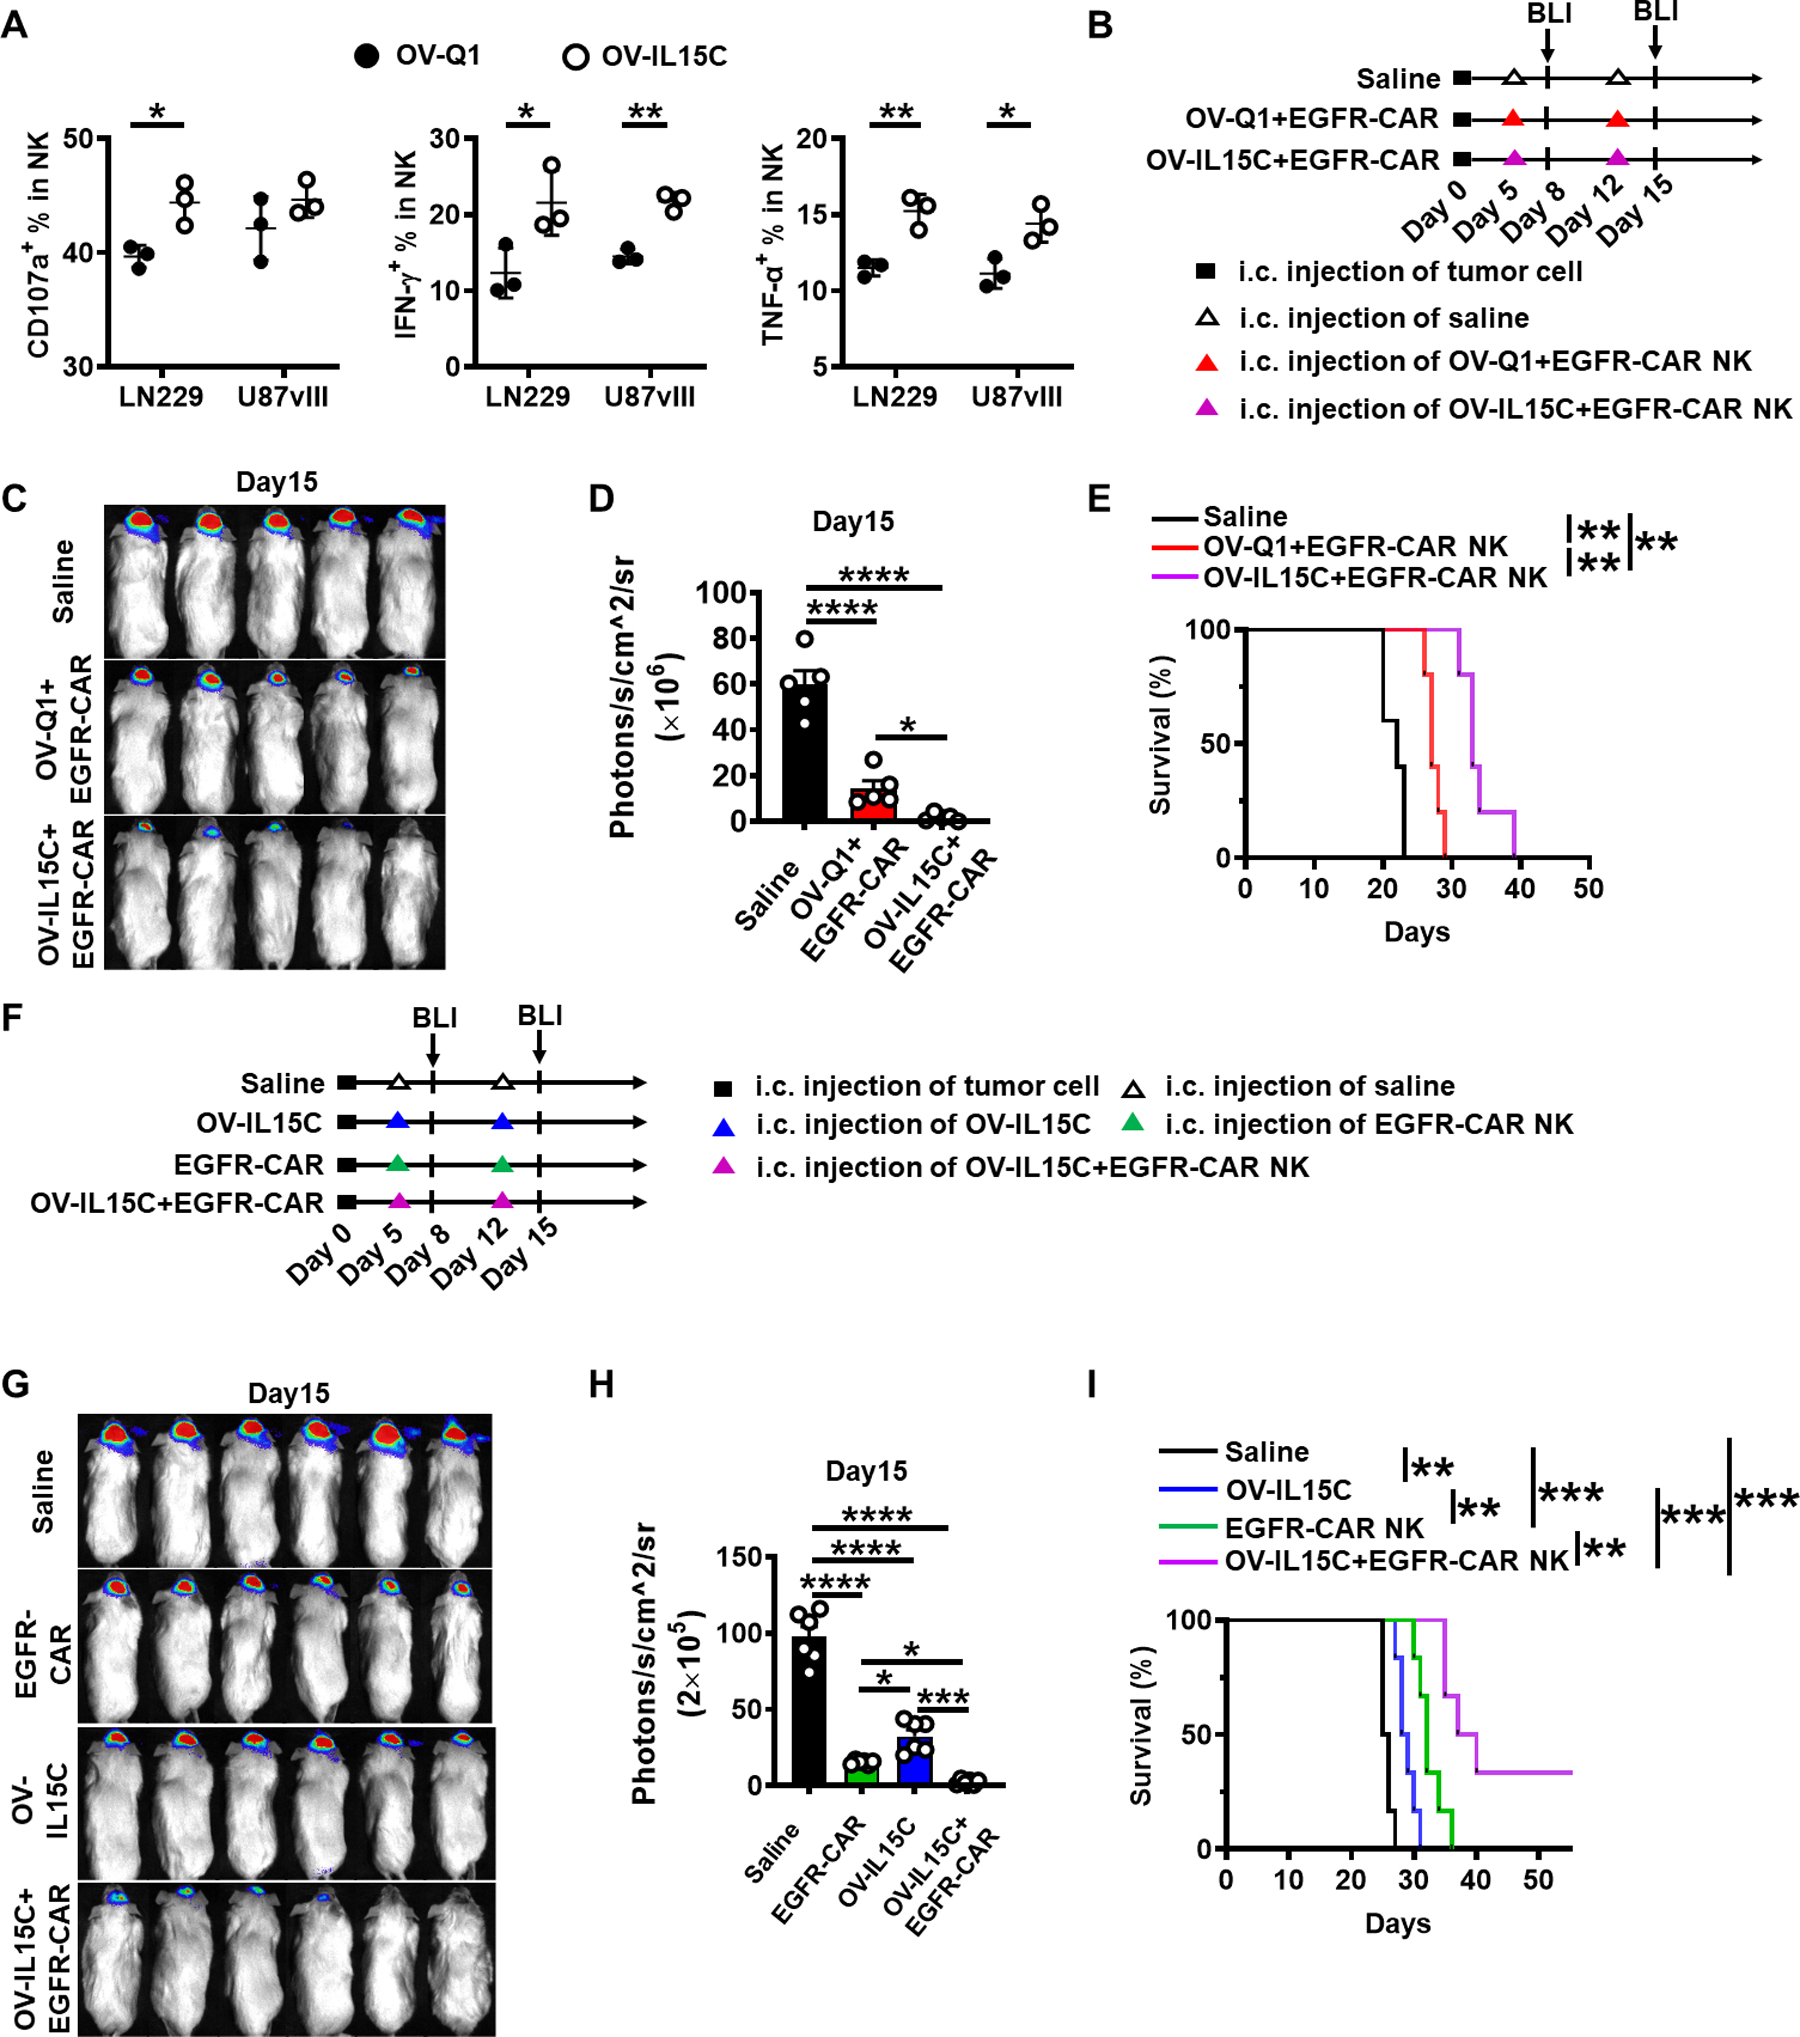
Figure 5. The combination of OV-IL15C and EGFR-CAR NK cells shows better effects than corresponding monotherapies in a xenograft GBM model.

A, Assessment of CD107a degranulation and levels of IFN-γ and TNF-α of frozen EGFR-CAR NK cells. GBM cell lines LN229 and U87vIII were used as target cells. The experiment was repeated three times with different frozen CAR NK cells with similar results. P values were calculated by unpaired t tests. Values are presented as mean ± SEM. *, P < 0.05; **, P < 0.01. B, Experimental timeline for in vivo study. On day 0, a xenograft GBM mouse model was established by intracranial injection of 1 × 10⁵ GBM30-luc cells into NSG mice. On days 5 and 12 after tumor implantation, mice were intratumorally injected with 2 × 10⁵ pfu of OV-Q1 plus 1 × 10⁶ frozen EGFR-CAR NK cells, 2 × 10⁵ pfu of OV-IL15C plus 1 × 10⁶ frozen EGFR-CAR NK cells, or saline alone. All transduced cells were unsorted. n=5 animals for each group. C, BLI of GBM30-luc tumors on day 15. D, Quantification of BLI in C. P values correct for ordinary one-way ANOVA using Holm-Sidak multiple comparisons test. Values are presented as mean ± SD. *, P < 0.05; ****, P < 0.0001. E, Survival of GBM30-luc-bearing mice treated with OV-Q1 or OV-IL15C combined with unsorted frozen EGFR-CAR NK cells or saline. Log-rank test was used to compare animal survival curves. **, P < 0.01. F, The xenograft GBM mouse model was established by intracranial injection of 1 × 10⁵ GBM30-luc cells into NSG mice on day 0. On days 5 and 12, mice were intratumorally injected with 1 × 10⁶ EGFR-CAR NK cells alone, 2 × 10⁵ pfu OV-IL15C alone, 2 × 10⁵ pfu OV-IL15C combined with 1 × 10⁶ EGFR-CAR NK cells or saline as control on each day. n=6 animals for each group. G, BLI of GBM30-luc tumors on day 15. H, Quantification of BLI in G. P values correct for ordinary one-way ANOVA using Holm-Sidak multiple comparisons test. Values are presented as mean ± SD. *, P < 0.05; ***, P < 0.001; ****, P < 0.0001. I, Survival of GBM30-luc bearing mice. Log-rank test was used to compare animal survival curves. **, P < 0.01, ***, P < 0.001.
