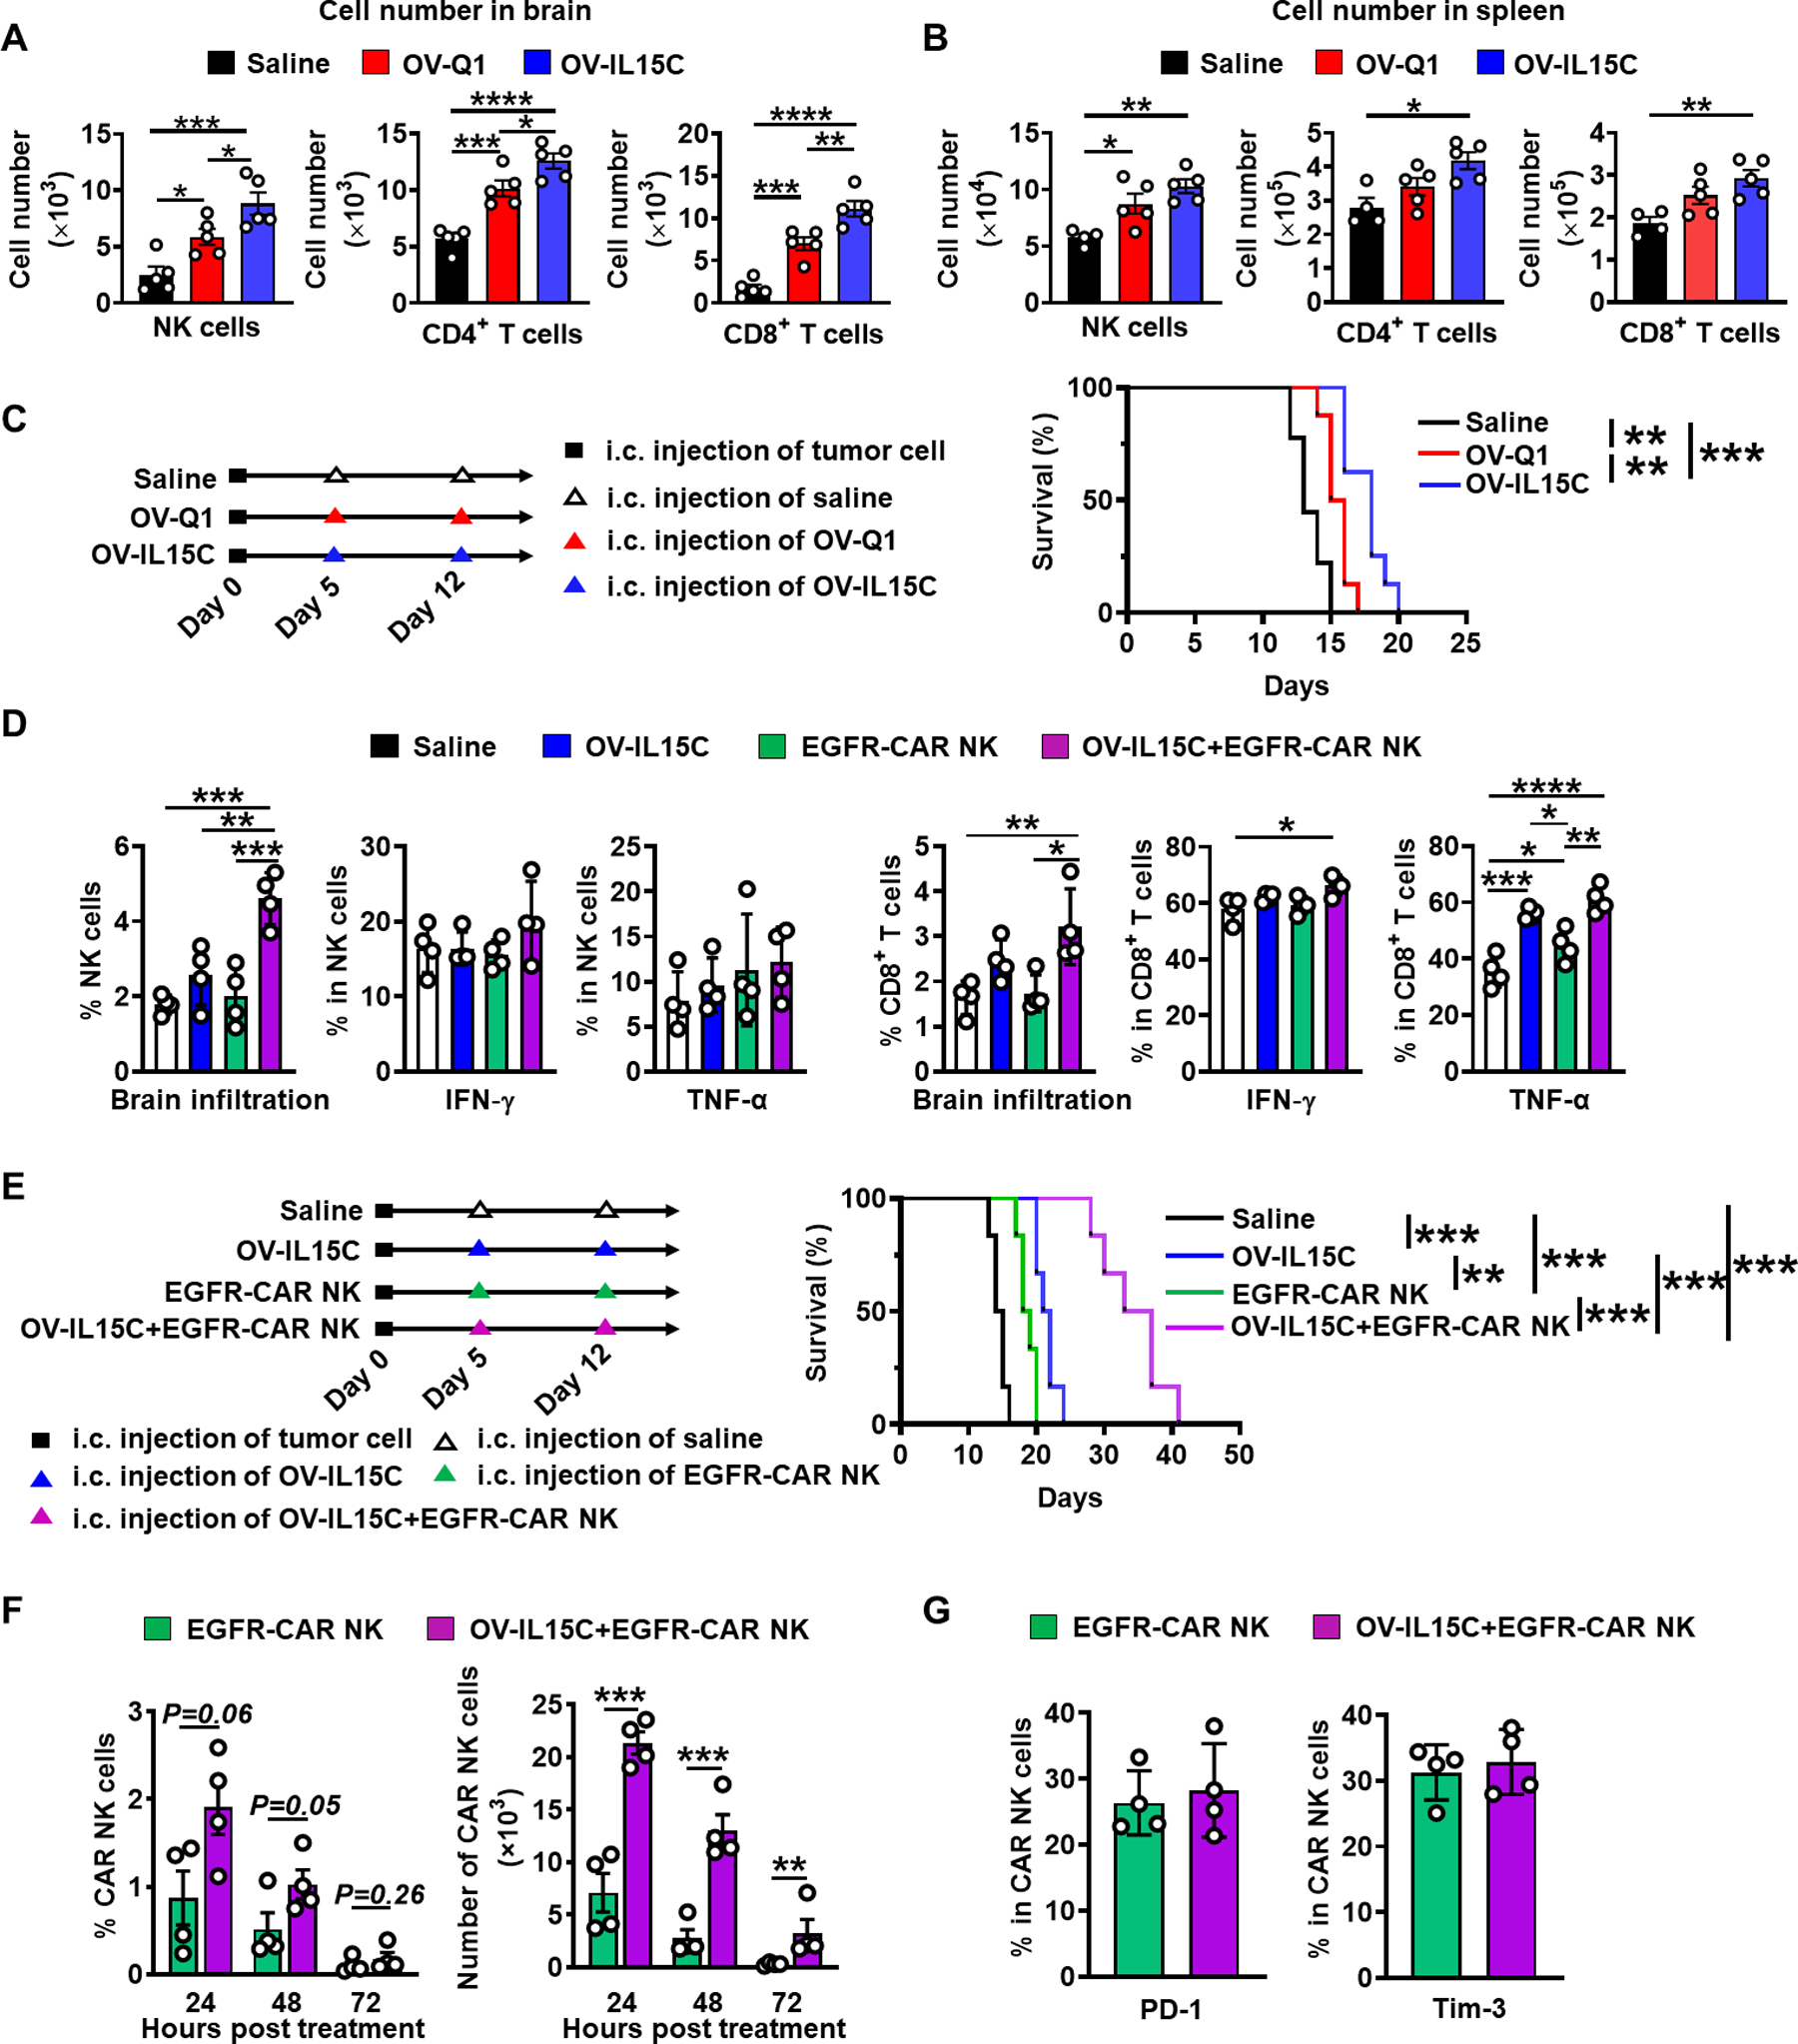
Figure 6. OV-IL15C increases NK and T cells infiltration and activation as well as the persistence of CAR NK cells and improves GBM therapy in the presence of EGFR-CAR NK cells in an immunocompetent model.

A-B, An immunocompetent GBM mouse model was established by intracranial injecting 1 × 10⁵ CT2A cells into C57BL/6 mice on day 0. n=6 animals for each group. On day 5, mice were intratumorally injected with 2 × 10⁵ pfu of OV-Q1, OV-IL15C, or saline as control. Representative of NK and T cells infiltration in the brain and spleen. P values correct for ordinary one-way ANOVA using Holm-Sidak multiple comparisons test. Values are presented as mean ± SD. *, P < 0.05; **, P < 0.01; ***, P < 0.001; ****, P < 0.0001. C, Left: in vivo experiment schedule. Right: survival of CT2A-bearing mice treated with OV-Q1, OV-IL15C, or saline as control. Log-rank test was used to compare animal survival curves. n=8 animals for each group. **, P < 0.01; ***, P < 0.001. D, The infiltration and activation of NK and CD8+ T cells in the brain. An immunocompetent model implanted with the murine GBM cell line CT2A expressing human EGFR (CT2A-hEGFR) was established on day 0. On day 5, mice were treated with OV-IL15C alone, frozen, and unsorted EGFR-CAR NK cells alone, the combination of the two agents, or saline. Three days later, mice were sacrificed, and brains were collected to assess NK and T cell infiltration as well as activation. P values were calculated after Log10 transformation due to big variations, followed by one-way ANOVA using Holm-Sidak multiple comparisons test. Values are presented as mean ± SD. *, P < 0.05; **, P < 0.01, ***, P < 0.001; ****, P < 0.0001. E, Left: in vivo experiment schedule. Right: survival of CT2A-hEGFR bearing mice treated with OV-IL15C alone, EGFR-CAR NK cells alone, or combination of the two agents or saline as control. Log-rank test was used to compare animal survival curves. n=6 animals for each group. **, P < 0.01, ***, P < 0.001. F, In vivo persistence of EGFR-CAR NK cells in the presence of OV-IL15C. An immunocompetent model implanted with the murine CT2A-hEGFR GBM cell line was used. Five days after tumor implanted, the mice were treated with frozen EGFR-CAR NK cells alone or in combination with OV-IL15C. Twenty-four, 48 hours or 72 hours after the treatment, mice were sacrificed to check CAR NK cells persistence. P values were calculated after Log10 transformation due to big variations, followed by unpaired t tests. Values are presented as mean ± SD. **, P < 0.01, ***, P < 0.001. G, EGFR-CAR NK cell exhaustion. An immunocompetent model implanted with the murine CT2A-hEGFR GBM cell line was used. Five days later, the mice were treated with frozen EGFR-CAR NK cells alone or in combination with OV-IL15C. Three days after the treatments, mice were sacrificed to determine CAR NK cell exhaustion. Unpaired t tests were used for statistical analysis.
