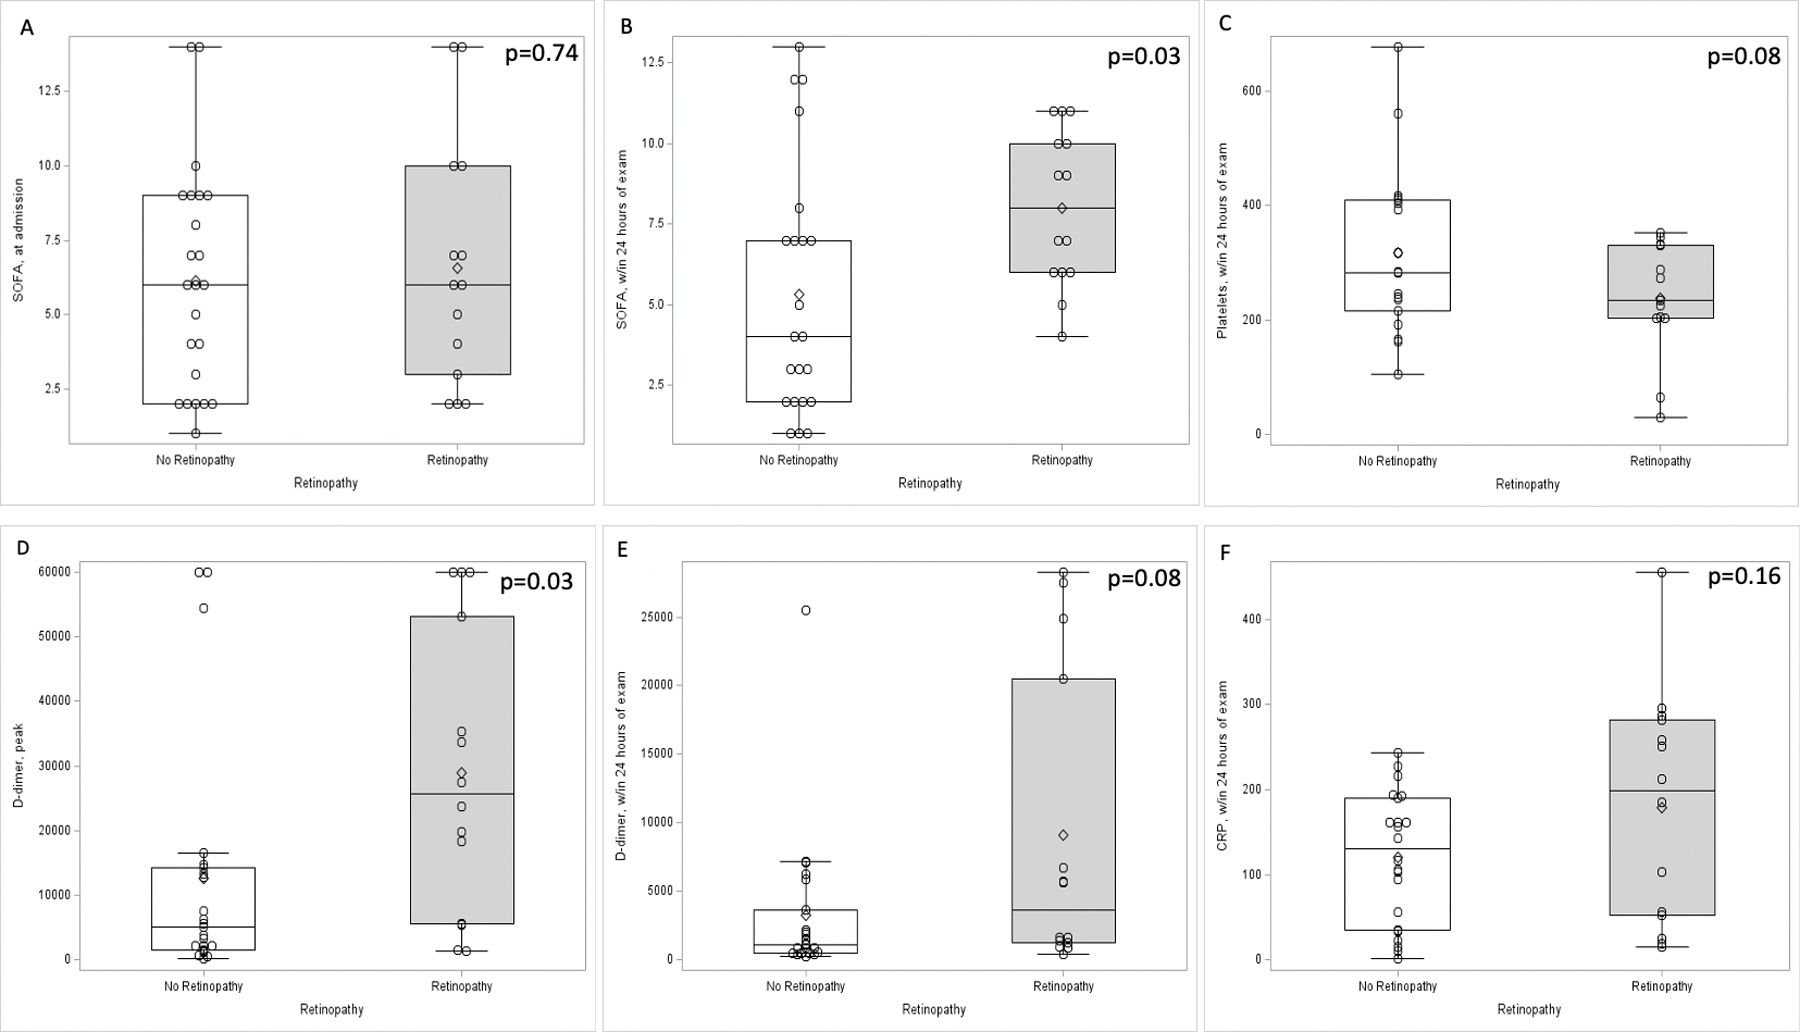
Figure 2.

Relationship of retinopathy with mean clinical and laboratory indices. Box-and-whisker plots show that admission SOFA scores were similar between patients with and without retinopathy (p=0.74, A), but were greater for patients with retinopathy than those without within 24–48 hours of the ophthalmic exam (SOFA score 8.0 for retinopathy group compared to 5.3 for no retinopathy group, p=0.03, B). Platelets were lower in the retinopathy group compared to the no retinopathy group (p=0.08, C). D-dimers within 24 hours of ophthalmic examination were greater in the retinopathy group (9099 ng/mL) compared to the no retinopathy group (3225 ng/mL, p=0.08, D). The peak D-dimer during patient hospitalization was also greater in the retinopathy group (28971 ng/mL) compared to the no retinopathy group (12575 ng/mL, p=0.03, E). C-reactive protein also was greater in the retinopathy group (p=0.16, F).
