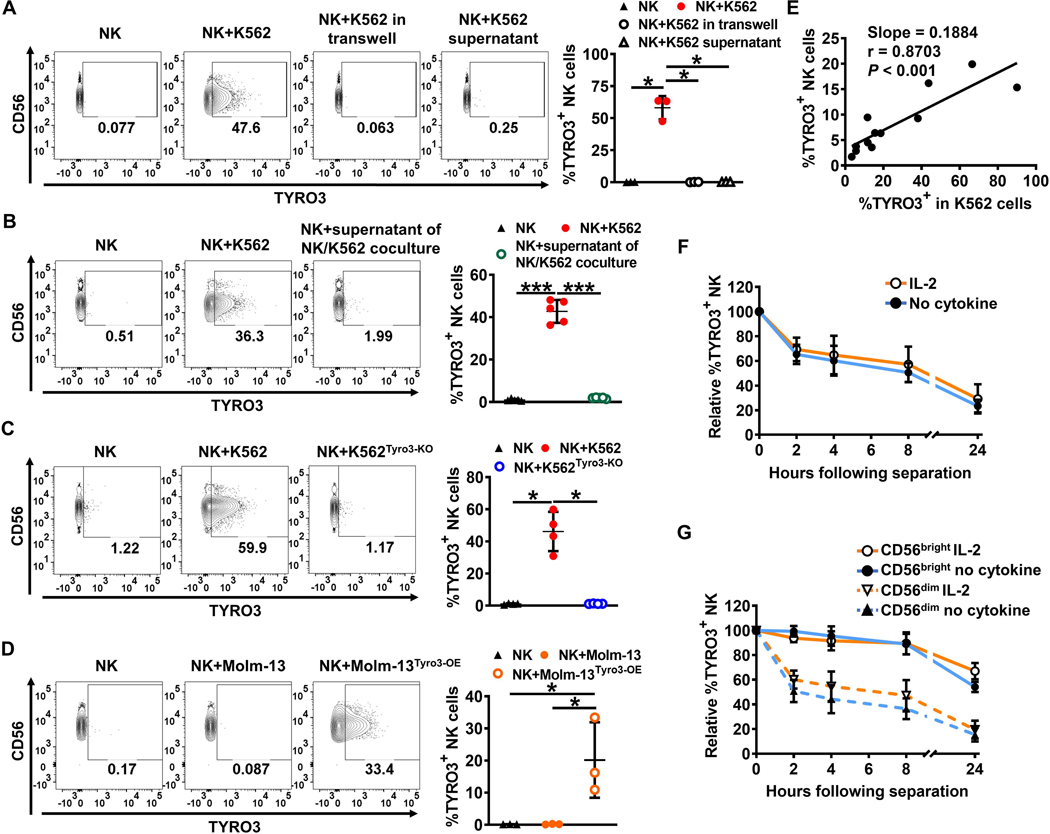
Figure 2. Rapid induction of TYRO3 expression on NK cells by TYRO3+ tumor cells requires cell–cell contact.
(A) Representative flow cytometry plots and summary data (n = 3) showing TYRO3 expression on NK cells from IL2-stimulated NK cells co-cultured with or without K562 cells in trans-well plates, co-cultured directly with or without K562, or co-cultured with or without supernatant from K562 culture for 1 h at an E/T ratio of 1:1. (B) Representative flow cytometry plots and summary data (n = 5) showing TYRO3 expression on NK cells from IL2-stimulated NK cells co-cultured directly with or without K562, or with or without supernatant from NK cells and K562 co-cultures for 1 h at an E/T ratio of 1:1. (C) Representative flow cytometry plots and summary data (n = 4) showing TYRO3 expression on NK cells from IL2-stimulated NK cells co-cultured with K562 or K562Tyro3-KO for 1 h at an E/T ratio of 1:1. (D) Representative flow cytometry plots and summary data (n = 3) showing TYRO3 expression on NK cells from IL2-stimulated NK cells co-cultured with Molm-13 or Molm-13Tyro3-OE for 1 h at an E/T ratio of 1:1. (E) Nonlinear regression analysis of the correlation between the percentages of acquired TYRO3 on NK cells and their corresponding TYRO3% on K562 cells. The correlation as calculated by Pearson test was statistically significant. Data are summarized from 3 different donors. (F and G) NK cells pre-treated with or without IL2 (150 IU/ml) were co-cultured with K562 for 1 h at an E/T ratio of 1:1. Summarized data show kinetics of persistence of acquired TYRO3 on NK cells (after sorting separation) from 4 independent experiments. One-way ANOVA was used for A–D and Pearson correlation coefficient for E. P values were adjusted by the Holm-Sidak method. *, P<0.05; **, P<0.01; ***, P<0.001. Data are presented as mean ± SD.

