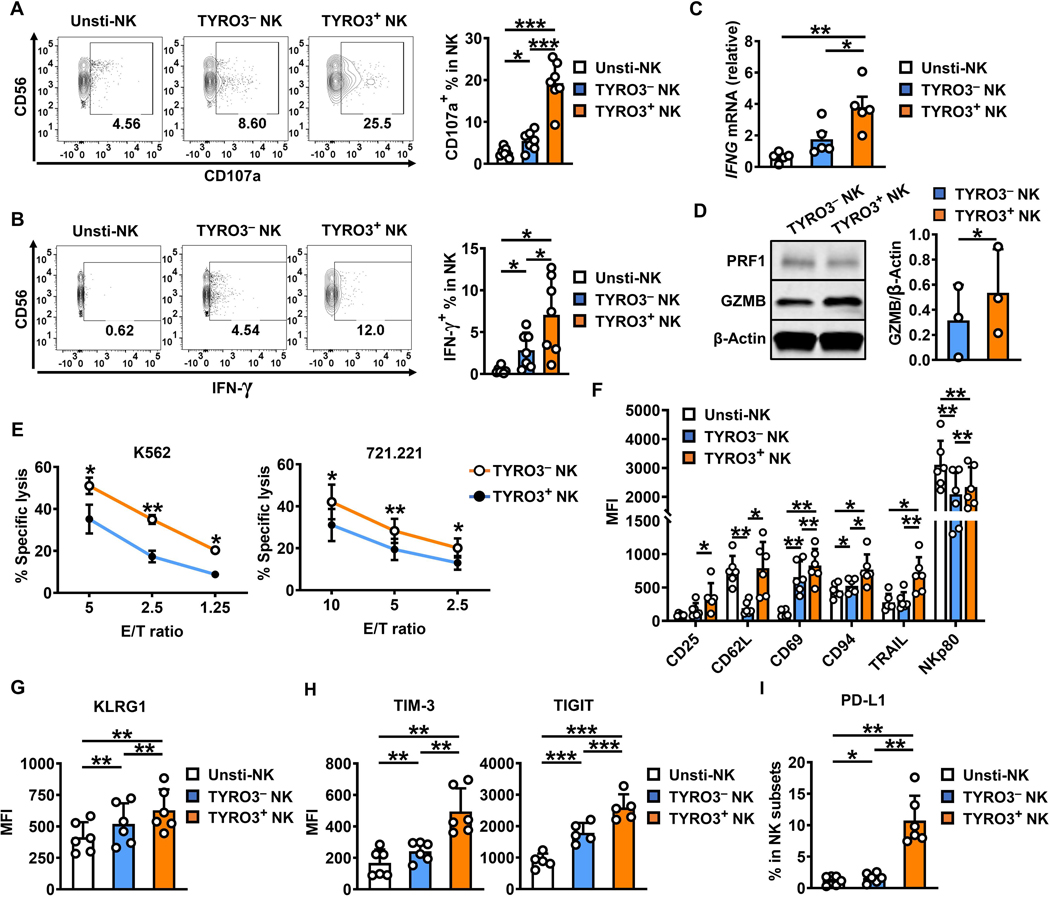
Figure 4. NK-cells acquiring TYRO3 via trogocytosis possess improved effector functions.
(A and B) Representative flow cytometry plots and summary data from 7 different donors showing the expression of CD107a and IFN-γ in TYRO3− and TYRO3+ NK cells after NK cells were co-cultured with K562 cells for 24 h at an E/T ratio of 10:1. (C) Expression of IFNG was assessed by qRT-PCR in FACS-sorted unstimulated, TYRO3− and TYRO3+ NK cells after NK cells were co-cultured with K562 cells for 24 h at an E/T ratio of 10:1. Summary data are representative from 5 different donors. (D) The protein levels of GZMB and PRF1 were assessed by immunoblotting in FACS-sorted TYRO3− and TYRO3+ NK cells after IL2-stimulated NK cells were co-cultured with K562 cells for 4 h at an E/T ratio of 1:1 with GlogiPlug. Summary data are for 3 different donors. (E) TYRO3− and TYRO3+ NK cells were FACS-sorted after NK cells were co-cultured with K562 cells for 24 h at an E/T ratio of 10:1, then co-cultured with 51Cr labeled-K562 or −721.221 cells for 4 h, followed by quantification of specific K562 or 721.221 cell lysis. Data are summarized from 4 different donors. (F-I) Primary human NK cells were incubated with or without K562 cells for 24 h at an E/T ratio of 10:1. (F) Summary data of activating receptors (CD25, CD62L, CD69, CD94, TRAIL and NKp80) on NK cells from 6 different donors. (G) Summary data of KLRG1 on NK cells from 6 different donors. (H) Summary data of exhaustion markers (TIM-3 and TIGIT) on NK cells from at least 5 different donors. (I) Summary data of PD-L1 on NK cells from 6 different donors. One-way ANOVA was used for A–C and G–I, paired t test for D, multiple t test for E, and two-way ANOVA for F. P values were adjusted by the Holm-Sidak’s method. *, P<0.05; **, P<0.01; ***, P<0.001. Data are presented as mean ± SD for A, B, D and F–I and as mean ± SEM for C and E.

