Figure 6.
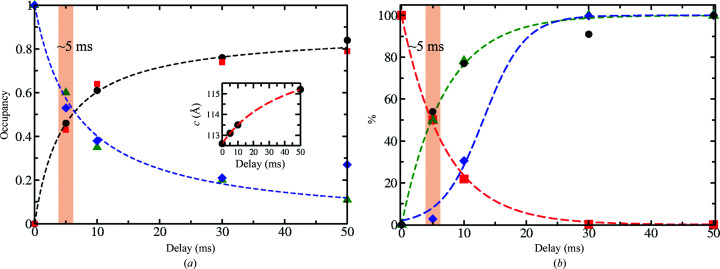
BlaC–CEF complex formation as a function of time. (a) Occupancies of CEF in the active site of BlaC at 5, 10, 30 and 50 ms in subunits B (spheres) and D (squares) as well as those of Pi (green triangles and blue diamonds) are plotted as a function of delay (the 30 ms data are from Olmos et al., 2018 ▸). The data are fitted with saturation curves [equations (1) and (2), black and blue dashed lines]. The two curves intersect at around 6 ms. Inset: the corresponding change in the unit-cell axis c. (b) Concentrations (in %) as calculated from diffusion and binding [equations (1)–(5)]; green dashed line and green triangles, increase of the calculated BlaC–CEF complex concentration averaged over all voxels in the crystal; red dashed line and squares, decrease of the free enzyme (BlaC); blue dashed line and diamonds, increase of the BlaC–CEF complex in the center of the platelet-shaped crystals. For comparison, the observed (refined) occupancies of the BlaC–CEF complex (normalized to 100% at 50 ms) are also shown (black spheres).

