
Figure 3: Probability distribution of MNIST (digit 3 vs. 8) samples before and after training MP-Boost-.
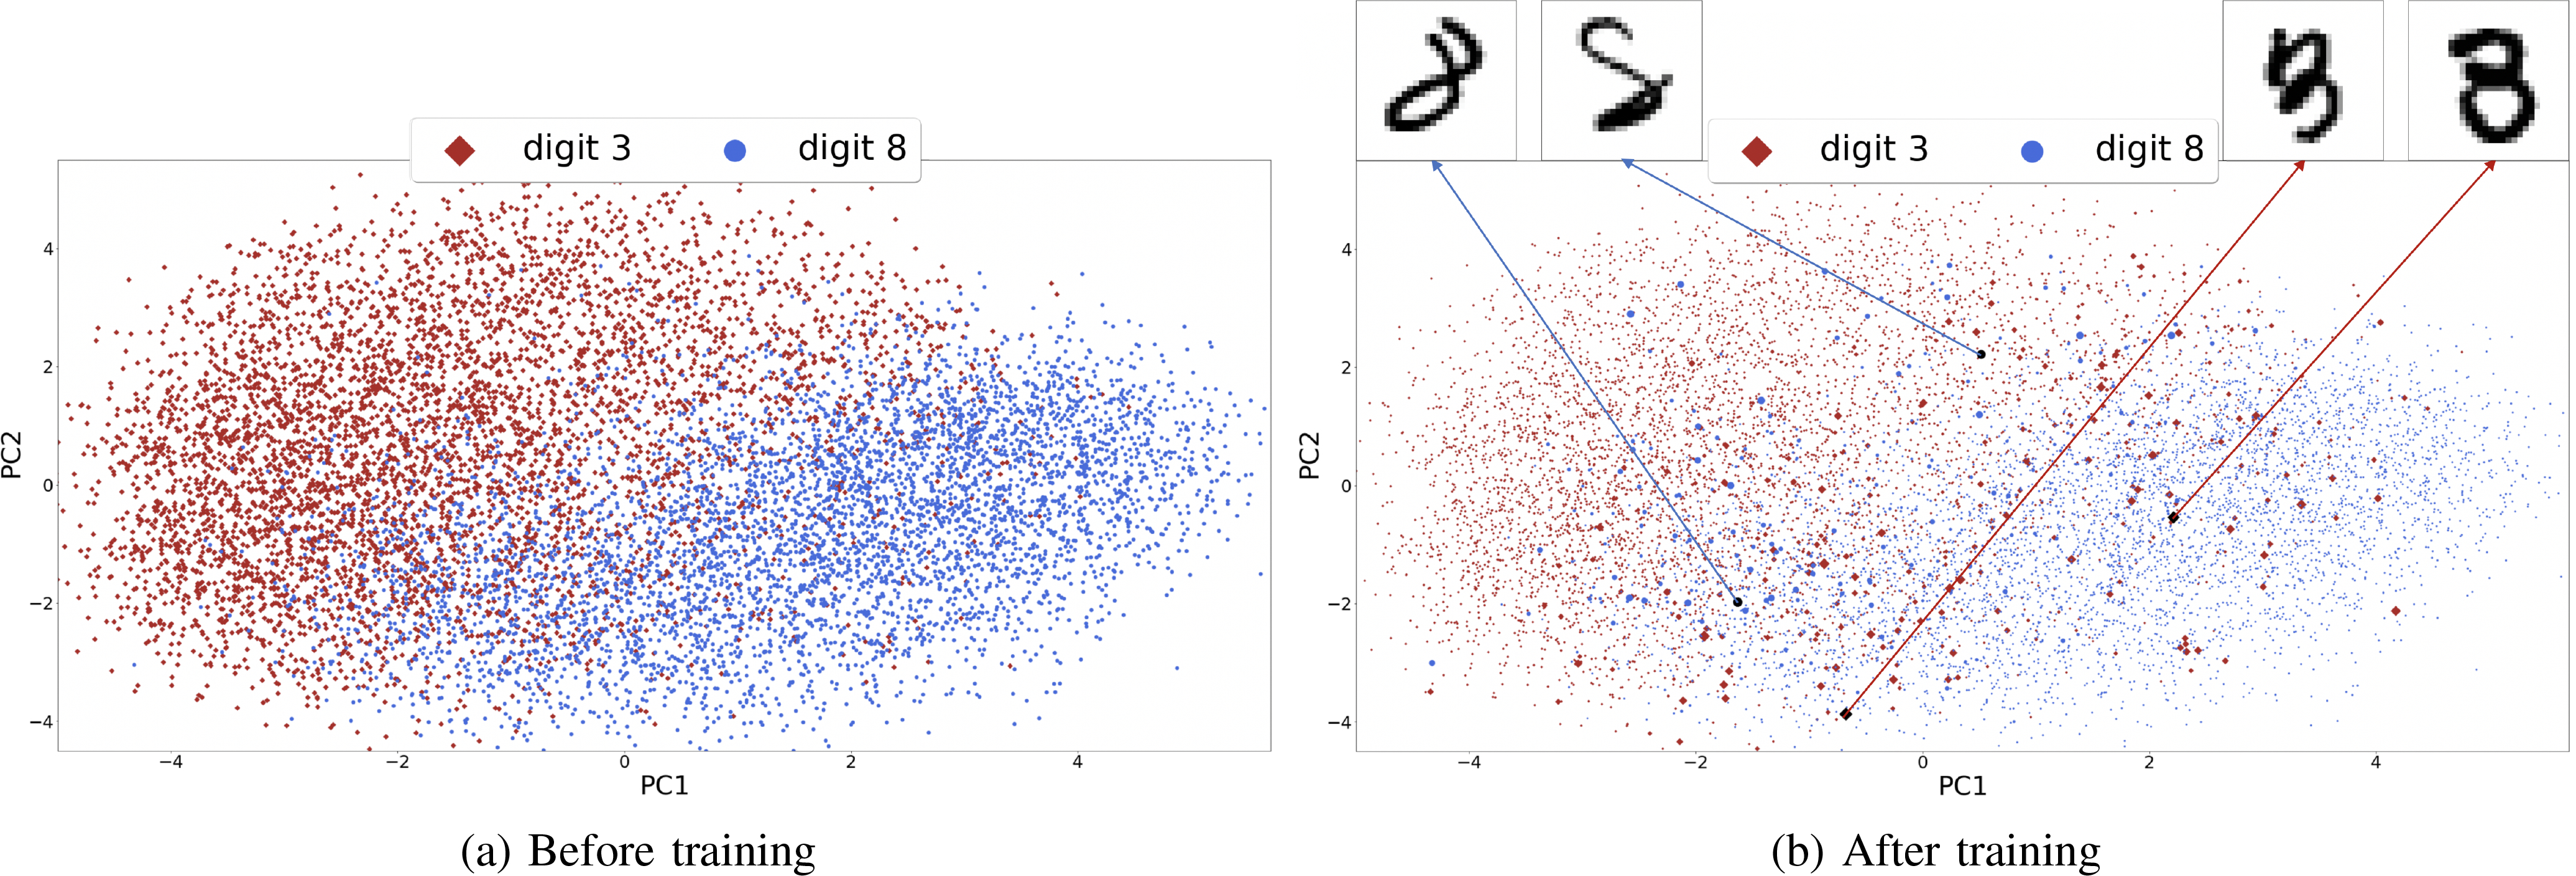
Samples are Projected onto a 2-dimensional space using PCA. The size of each point (sample) indicates its relative probability. After training, samples close to the boundary have higher probabilities. The displayed samples are visually hard to be learned and have high probabilities.