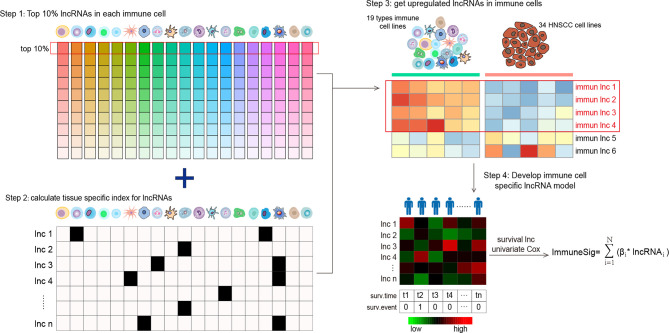
Figure 1.
Flow graph for characterizing the lncRNA landscape of HNSCC-infiltrating immune cells and for building a prognostic signature. Step 1: all lncRNAs were ranked according to their mean expression levels in each immune cell type, and the top 10% expressed lncRNAs were chosen as candidate lncRNAs. Step 2: the TSI scores of a total of 958 lncRNAs were calculated to reflect their expression specificity with respect to the 19 immune cell types. Step 3: lncRNAs with high TSI values (> 0.1) were further analyzed for differential expression between the 19 types of immune cells and the 34 HNSCC cell lines. Step 4: the lncRNAs upregulated in immune cells were screened out and compared with HNSCC cells. lncRNA, long non-coding RNA; HNSCC, head and neck squamous cell carcinoma; TSI, tissue specificity index.

