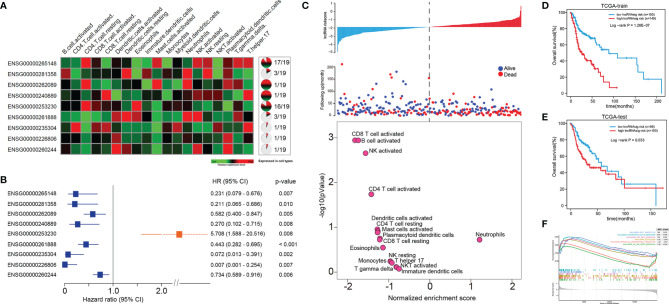
Figure 2.
A Ti-lncRNA signature consisting of nine lncRNAs was identified as a prognostic indicator associated with OS in TCGA cohort. (A) Expression heatmap (left) and expression specificity proportion (right) of the nine Ti-lncRNAs in the 19 immune cell types. (B) Forest plot of the hazards ratios (HRs) with 95% confidence interval (CI) to show the associations of the Ti-lncRNAs with OS in the training cohort of TCGA. (C) A Ti-lncRNA signature was developed using a linear combination of the expression values of the nine Ti-LncRNAs, weighted by their estimated regression coefficients from multivariate Cox regression analysis, and volcano plots for the enrichment of immune cell types for patients with high scores and low scores calculated based on the NES from the GSEA. (D) Differences in OS between patients with low signature risk scores and those with high risk scores was analyzed in the training cohort of TCGA using the Kaplan–Meier method to construct an OS curve. (E) The Ti-lncRNA signature was analyzed for its association with survival in the test cohort of TCGA. (F) Biological signaling pathways enriched in patients with high Ti-lncRNA scores. lncRNA, long non-coding RNA; OS, overall survival; TCGA, The Cancer Genome Atlas; Ti-lncRNA, tumor-infiltrating immune-related lncRNA; NES, normalized enrichment score; GSEA, gene set enrichment analysis.

