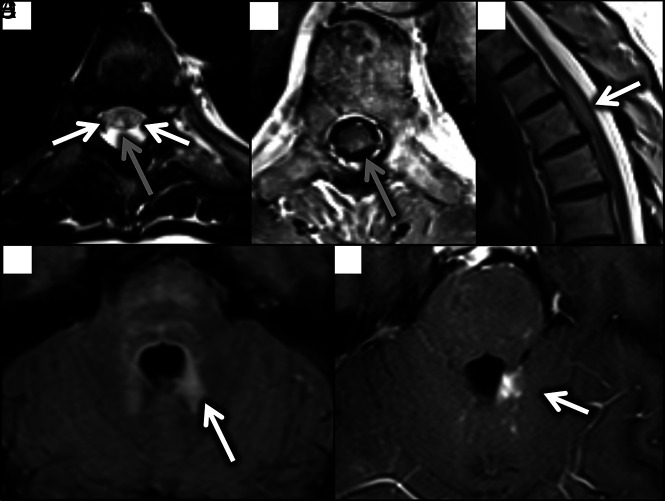
FIG 3.
Axial T2 (A) and T1 postcontrast (B) images demonstrate T2 hyperintensity involving the posterior columns (gray arrow), with faint involvement of the lateral columns (white arrows, A). There was corresponding scattered patchy enhancement in these regions (gray arrow, B). T2 hyperintensity and expansion of the upper thoracic cord was well-demonstrated on sagittal views (white arrow, C). Brain MR imaging shows T2/FLAIR hyperintensity and corresponding enhancement surrounding the fourth ventricle (white arrows, D and E).

