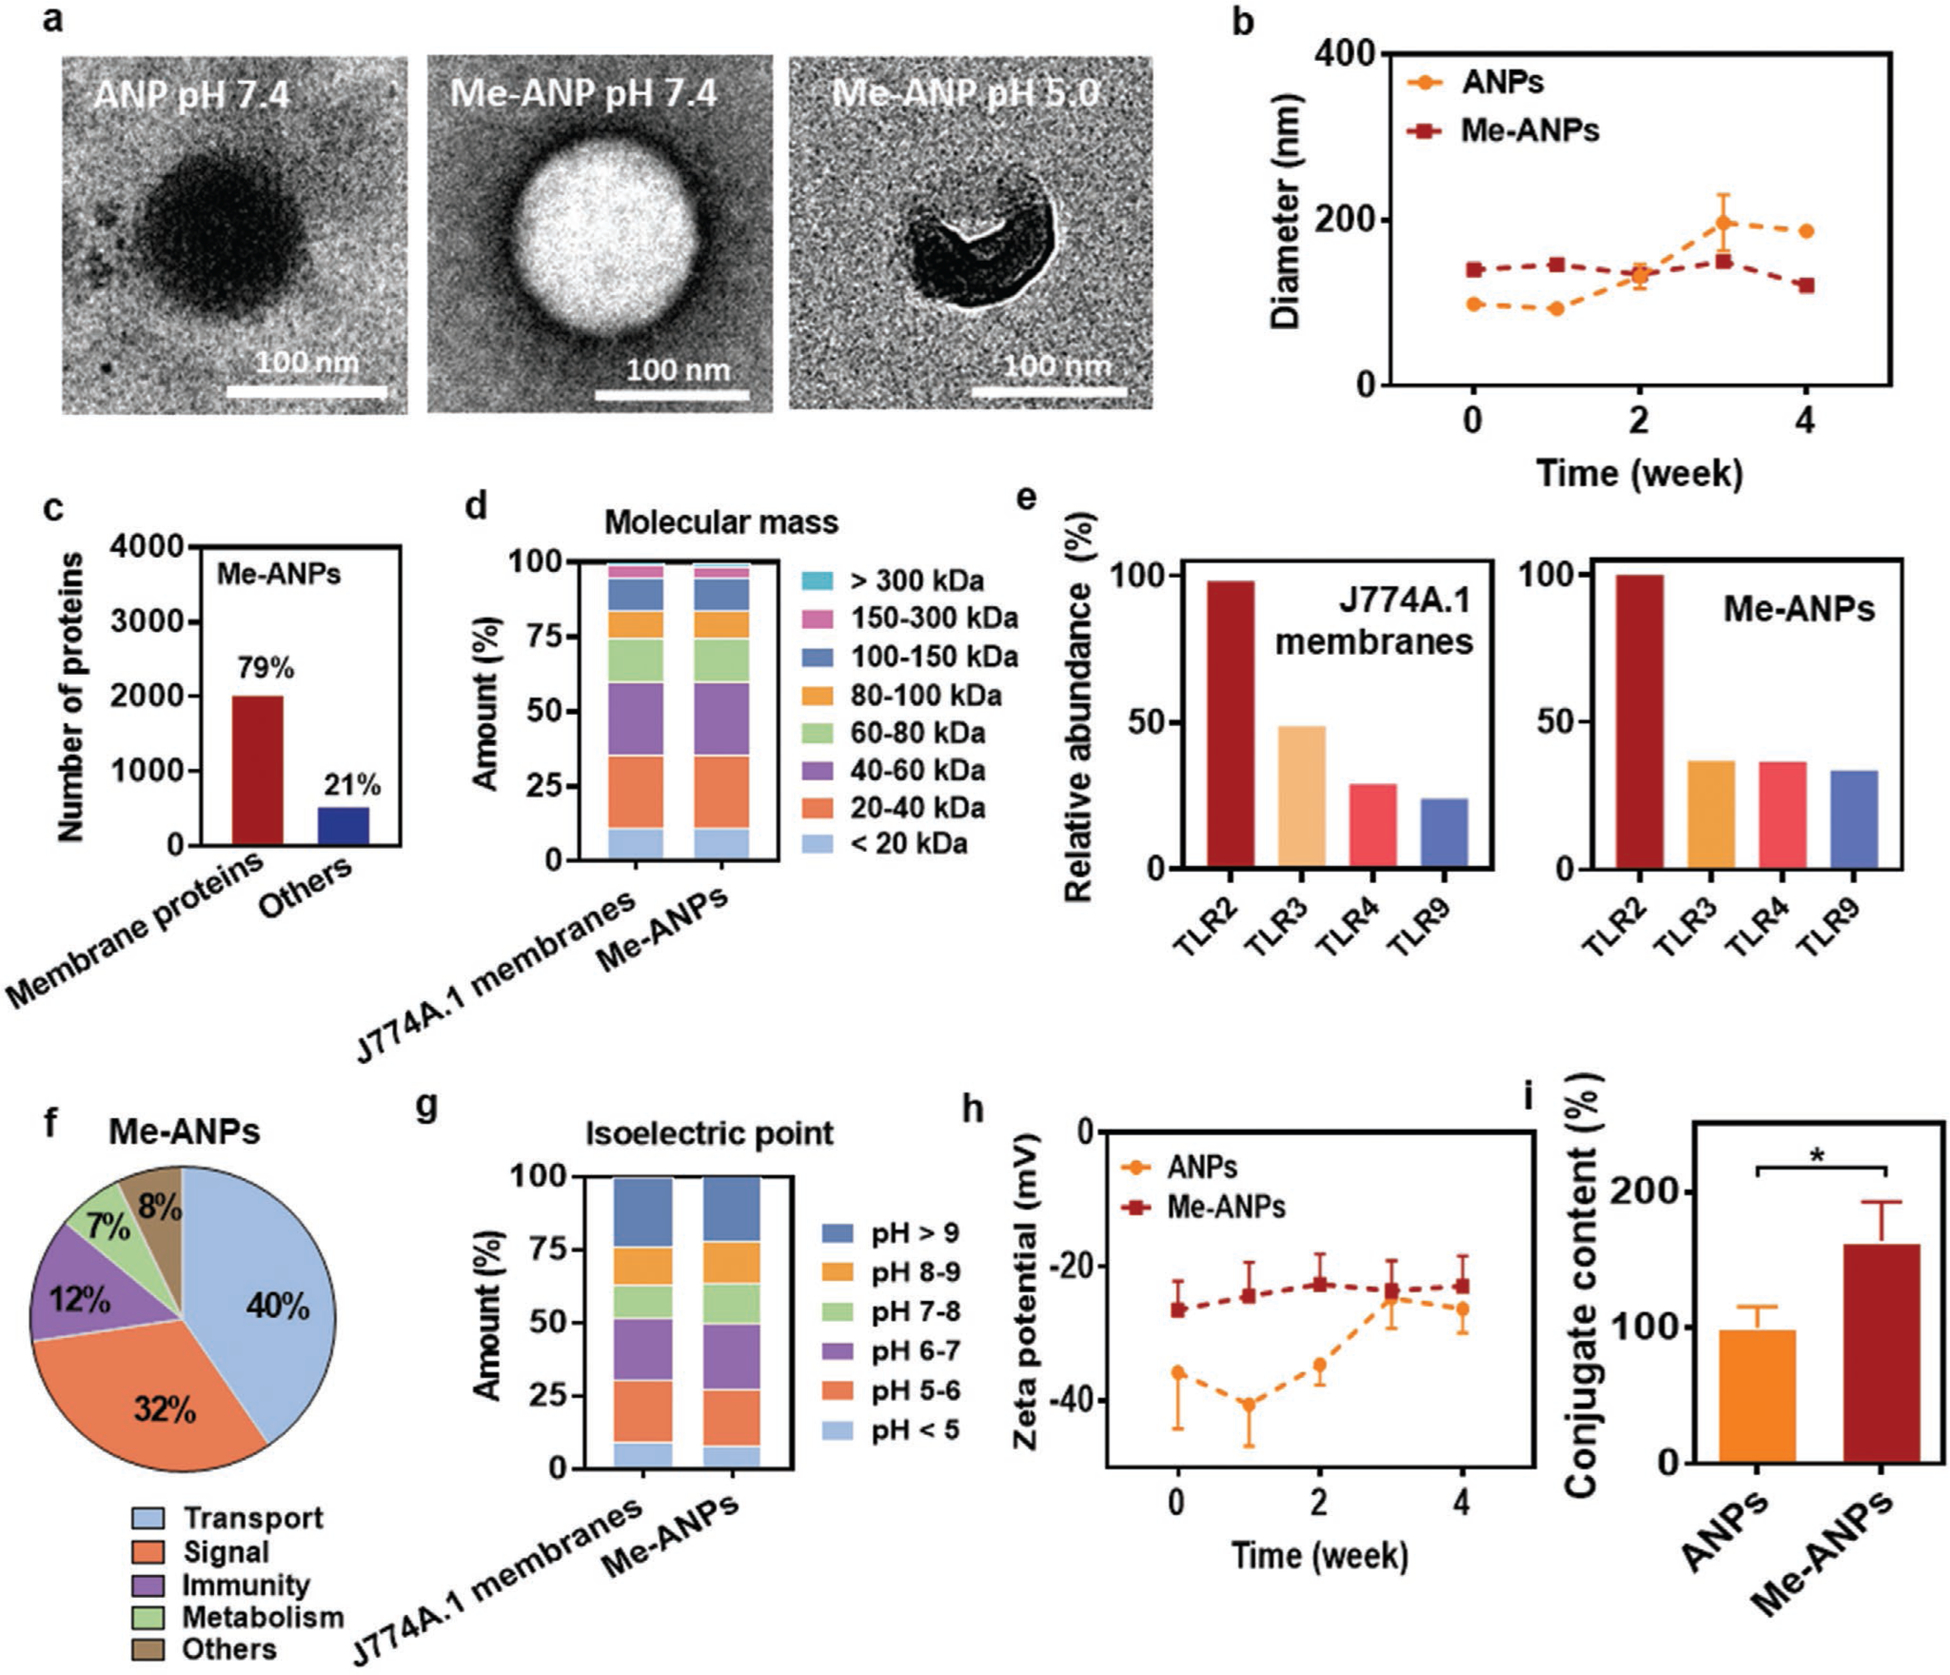
Figure 2.

Characteristics of mouse J774A.1 membrane-encapsulated, antimicrobial-conjugated nanoparticles (Me-ANPs). a) Transmission electron micrographs of a negative-stained (0.5% uranyl acetate) ANP and a Me-ANP after 24 h in 10 × 10−3 M potassium phosphate buffer at different pH, showing membrane-encapsulation as a dark area around the NP. Note partial disassembly of the Me-ANP at pH 5.0. Lower magnification electron micrographs showing more ANPs are presented in Figure S5 (Supporting Information). b) Hydrodynamic diameters in 10 × 10−3 M potassium phosphate buffer of ANPs in absence and presence of membrane-encapsulation, as a function of storage time in buffer. Data were expressed as means ± standard deviations over triplicate nanocarrier preparations. c) The number of J774A.1 membrane proteins and other proteins on Me-ANP identified by liquid chromatography-mass spectrometry (LC-MS). d) Molecular mass (kDA) distribution of membrane proteins in mouse J774A.1 membranes and Me-ANPs by LC-MS. e) Relative abundance of Toll-like receptors identified using LC-MS involved in bacterial recognition on J774A.1 membranes and Me-ANPs. and abundance of TLR-2 in J774A.1 membranes set at 100%. f) Functional characterization of membrane proteins identified on Me-ANPs. Proteins were classified according to UniProt/GO database[51] using the LC-MS data as input. g) Same as panel (d), now for the distribution of isoelectric points of membrane proteins. h) Zeta potentials in 10 × 10−3 M potassium phosphate buffer of ANPs in absence and presence of membrane-encapsulation, as a function of storage time in buffer. Data were expressed as means ± standard deviations over triplicate nanocarrier preparations. i) Antimicrobial-conjugate content in wt% of Me-ANPs, expressed relative to the initial antimicrobial-conjugate content of ANPs in absence of encapsulation. Antimicrobial-conjugate contents were derived from UV–vis spectroscopy (see Figure S6, Supporting Information). Data are expressed as means ± standard deviations over triplicate nanocarrier preparations. Asterisks above the data points indicate statistical significance at p < 0.05 (*, Student’s t-test) between ANPs and Me-ANPs.
