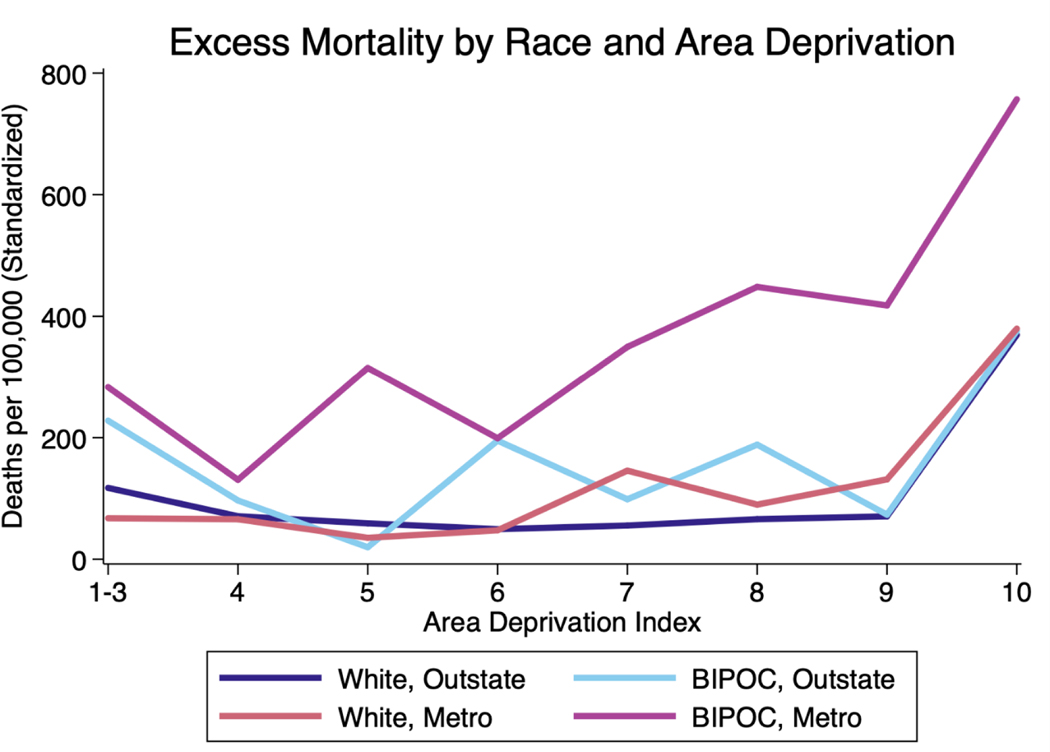
Exhibit 1 (figure):
2020 Excess Mortality (Adjusted for Age and Sex) in Minnesota by Race, Region, and Area Deprivation. Data Sources: Death Certificates from the Minnesota Department of Health (MDH) Office of Vital Records linked to the Area Deprivation Index (ADI) data.
Notes: An ADI ranking of one indicates the lowest level of disadvantage within the state of Minnesota and ten indicates the highest level of disadvantage within the state of Minnesota. Excess mortality was calculated by subtracting the average all-cause mortality from 2017–2019 from mortality in 2020. Twin Cities Metro includes all deaths among residents of the 7-County Twin Cities Metro area (Anoka, Carver, Dakota, Hennepin, Ramsey, Scott, and Washington counties). BIPOC includes all people of color who did not identify their race as white. Death rates in this exhibit are standardized for age and sex (details in Appendix A).

