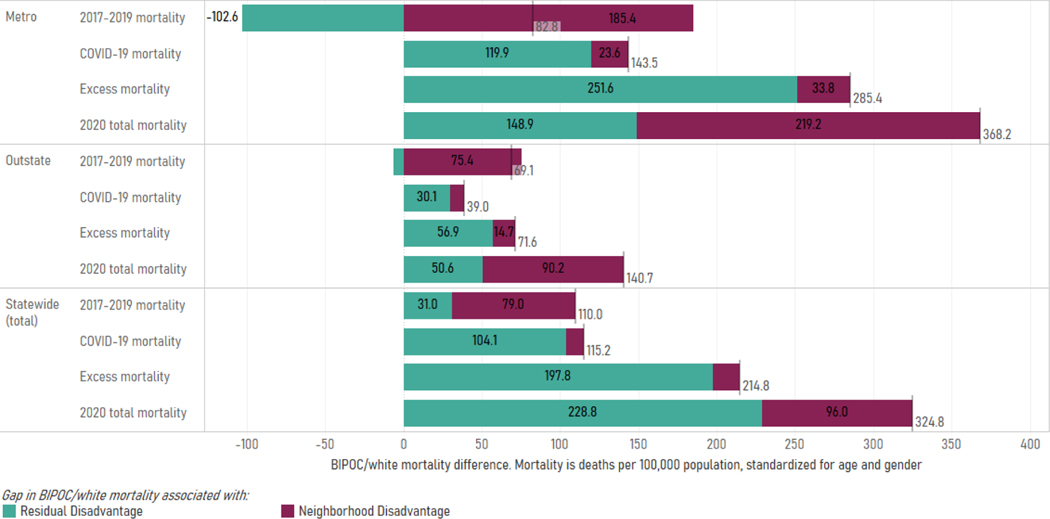
Exhibit 4 (figure):
Gap in BIPOC/White Mortality, by Type. Data Sources: Death Certificates from the Minnesota Department of Health (MDH) Office of Vital Records linked to the Area Deprivation Index (ADI) data.
Notes: Pre-2020 mortality reflects the average all-cause mortality from 2017–2019. COVID-19 mortality includes lab-confirmed COVID-19 (ICD U07.1) on the death certificate. Excess mortality was calculated by subtracting the average all-cause mortality from 2017–2019 from mortality in 2020 for the same calendar months. 2020 total mortality includes all-cause mortality (including COVID-19 mortality) during 2020. The gap in BIPOC/white mortality associated with ‘neighborhood disadvantage’ indicates how much of the mortality gap is associated with whites living in more advantaged areas on average, whereas ‘residual disadvantage’ is the gap between BIPOC/whites that live in the same level of disadvantage. The vertical line on each bar indicates the total BIPOC/white disparity and is the sum of neighborhood disadvantage and residual disadvantage.

