Figure 1.
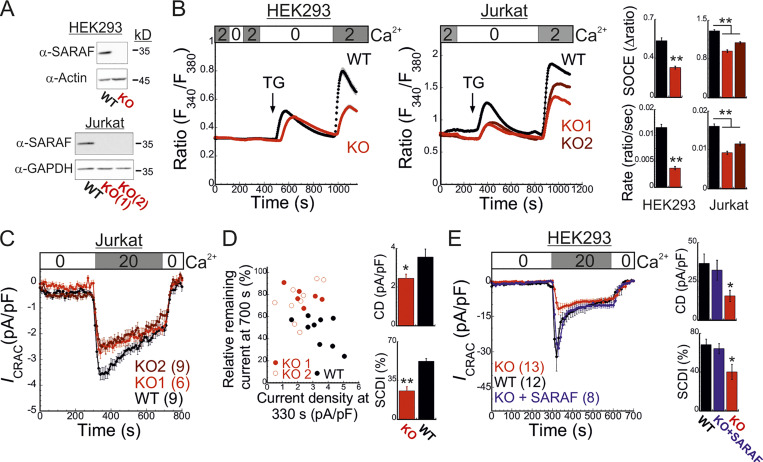
SARAF regulates current magnitude and SCDI of CRAC channels. (A) WB analysis of SARAF, GAPDH, and actin expression in WT and SARAF KO HEK293 and Jurkat cells, as indicated. (B) Mean ± SEM intracellular Ca2+ responses (left panels) and quantification of SOCE (right panels) in WT (black) or SARAF KO HEK293 (red) or SARAF KO Jurkat (light/dark red) cell lines. n = 152–295 cells and n = 22–48 cells in each group of Jurkat and HEK293 cells, respectively. (C) Time course of mean ± SEM current densities recorded for WT or SARAF KO Jurkat cells following superfusion with the indicated calcium concentration (in mM) at a holding potential of −120 mV (left). (D) Left: The degree of current activation (peak current densities at 330 s) plotted as a function of the degree of current inactivation (percentage current remaining at 700 s) for individual WT and SARAF KO Jurkat T cells. Right: Bar graphs show the average values from all cells. CD, current density. (E) Left: Time course of mean ± SEM currents measured in WT or SARAF KO HEK293 cells coexpressing EYFP-STIM1 and mCherry-Orai1 without or together with SARAF (blue). Right: Bar graphs show the mean ± SEM from all cells. All numbers in parentheses represent the number of cells. P values were calculated with one-way ANOVA using Tukey’s post hoc test in B and E and using a two-tailed Student’s t test in D. *, P < 0.05; **, P < 0.01.

