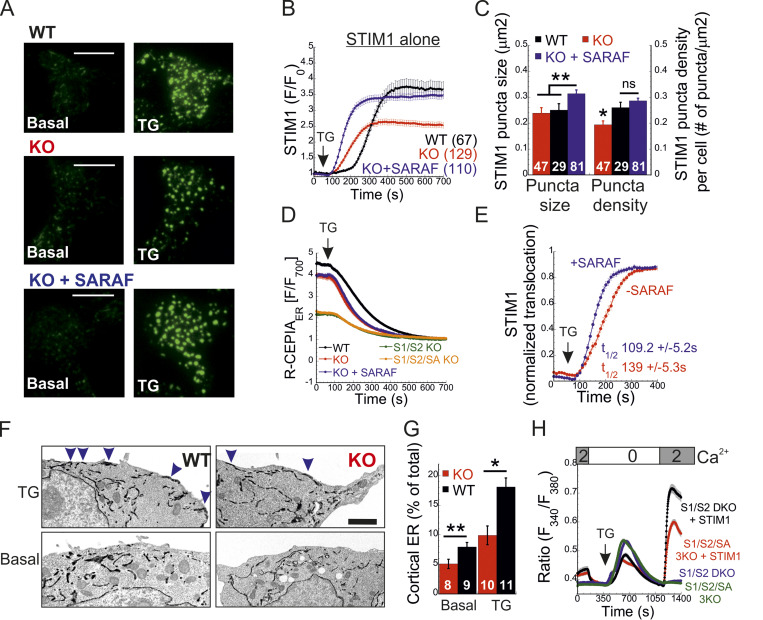
Figure 2.
SARAF facilitates translocation of STIM1 to ER–PM junctions and promotes Ca2+ entry by STIM1. (A and B) Representative TIRFM images (A) and plot of the mean ± SEM time course (B) of changes in EYFP-STIM1 fluorescence (F) in WT or SARAF KO cells expressing EYFP-STIM1 alone or together with SARAF (blue trace) at the PM following ER Ca2+ depletion by TG (1 µM). Scale bar, 10 µm. (C) Quantification of the mean size and number (±SEM) of EYFP-STIM1 puncta per cell in WT, SARAF KO, and SARAF rescue cells following treatment with TG for 10 min. (D) ER Ca2+ was measured by tracking the fluorescence of R-CEPIA (Kd = 565 ± 58 µM) in WT (n = 545), SARAF KO (n = 243), S1/S2 DKO (n = 167), or S1/S2/SA TKO (n = 166) cells or in SARAF KO cells reexpressing SARAF (n = 478) following treatment with TG (1 µM). Plot shows the time course of the mean ± SEM normalized R-CEPIA fluorescence. (E) The mean ± SEM normalized change of EYFP-STIM1 fluorescence at the PM in SARAF KO and rescue cells following treatment with TG (1 µM). (F) Representative EM images of WT and KO cells expressing ER-targeted peroxidase (ER-HRP) and STIM1 before and after TG application. Scale bar, 2 µm. (G) Quantification of cortical ER (i.e., ER–PM junctions; blue arrows) before and after TG treatment. (H) The mean ± SEM intracellular Ca2+ responses of SOCE are shown for untransfected S1/S2 DKO (n = 130) or S1/S2/SA TKO (n = 150) cells and for S1/S2 DKO (n = 127) or S1/S2/SA TKO (n = 188) cells expressing EYFP-STIM1. All numbers in parentheses or within bars for quantification represent the number of cells. P values were calculated with one-way ANOVA using Tukey’s post hoc test in C and using a two-tailed Student’s t test in G. *, P < 0.05; **, P < 0.01.

