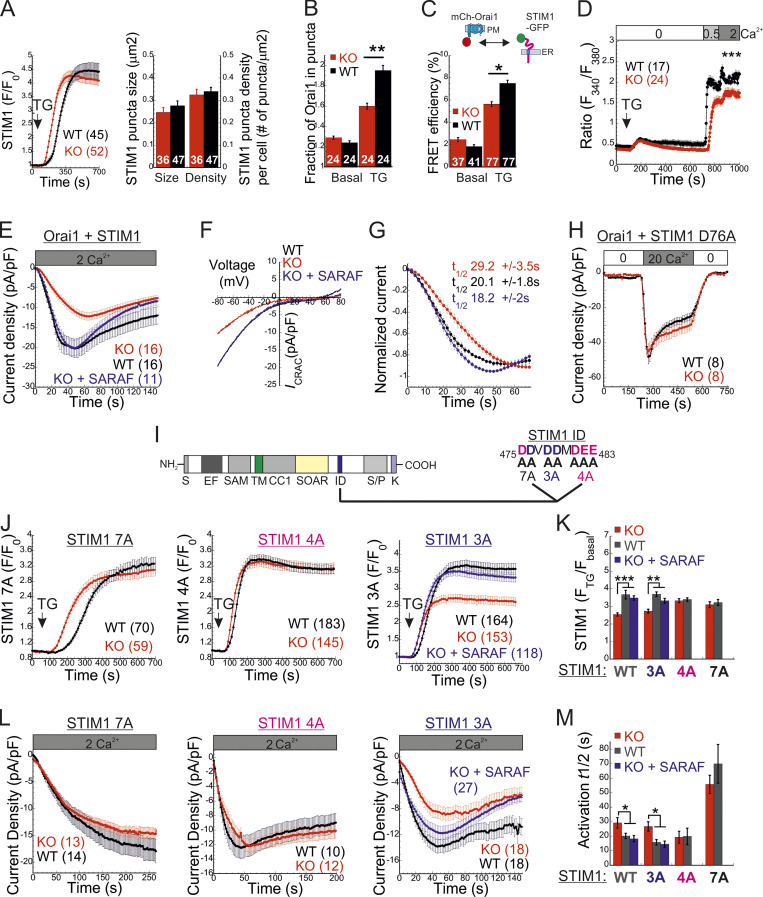
Figure 4.
SARAF facilitates CRAC channel activation by removing an activation constraint imposed by the STIM1 ID. (A) Left: Average time course (± SEM) of changes in EYFP-STIM1 fluorescence in cells expressing EYFP-STIM1 and Orai1 at the PM following ER Ca2+ depletion by TG (1 µM). Right: Quantification of the mean ± SEM size and number of EYFP-STIM1 puncta per cell in WT and SARAF KO cells following treatment with TG for 10 min. (B) Quantification of the mean ± SEM fraction of mCherry-Orai1 fluorescence in EYFP-STIM1 puncta before and after TG treatment. (C) Quantification of the mean ± SEM FRET efficiency measured in cells coexpressing STIM1-EGFP and mCherry-Orai1 before and after TG treatment. (D) Averaged intracellular Ca2+ responses (±SEM) of SOCE in WT or SARAF KO HEK293 cells coexpressing STIM1 and Orai1. (E and F) Time course of mean ± SEM current densities (E) and plots of current–voltage (F) of whole-cell currents in HEK293 cells expressing STIM1 and Orai1 and infused with 50 µM IP3 under 2 mM external calcium are shown for the indicated number of WT (black), SARAF KO (red), or SARAF KO rescue (blue) cells. (G) Time course of mean ± SEM normalized current development shown for data in E. The mean ± SEM half-maximal activation times (t1/2) are indicated. (H) Time course of mean ± SEM currents measured in WT or SARAF KO HEK293 cells coexpressing STIM1-EYFP D76A and mCherry-Orai1. (I) Illustration of different domains of STIM1 (left), the STIM1 ID sequence, and the location of the 7A (black), 4A (magenta), and 3A (blue) mutations (right). (J) Time course of average changes (± SEM) in EYFP-STIM1 fluorescence at the PM following ER Ca2+ depletion by TG (1 µM). (K) Quantification of the averaged (± SEM) STIM1 translocation to ER–PM junctions after TG treatment in cells expressing the indicated EYFP-STIM1 mutant with or without SARAF. (L) Time course of averaged currents (± SEM) recorded from WT or SARAF KO cells coexpressing EYFP-Orai1 together with 7A, 4A, or 3A STIM1-mCherry mutants. (M) Quantification of the mean ± SEM half times for current development in cells expressing Orai1 together with the indicated EYFP-STIM1 mutant with or without SARAF. All numbers in parentheses or within bars for quantification represent the number of cells. P values were calculated with one-way ANOVA using Tukey’s post hoc test in K and M and using a two-tailed Student’s t test in B–D. *, P < 0.05; **, P < 0.01; ***, P < 0.001.

