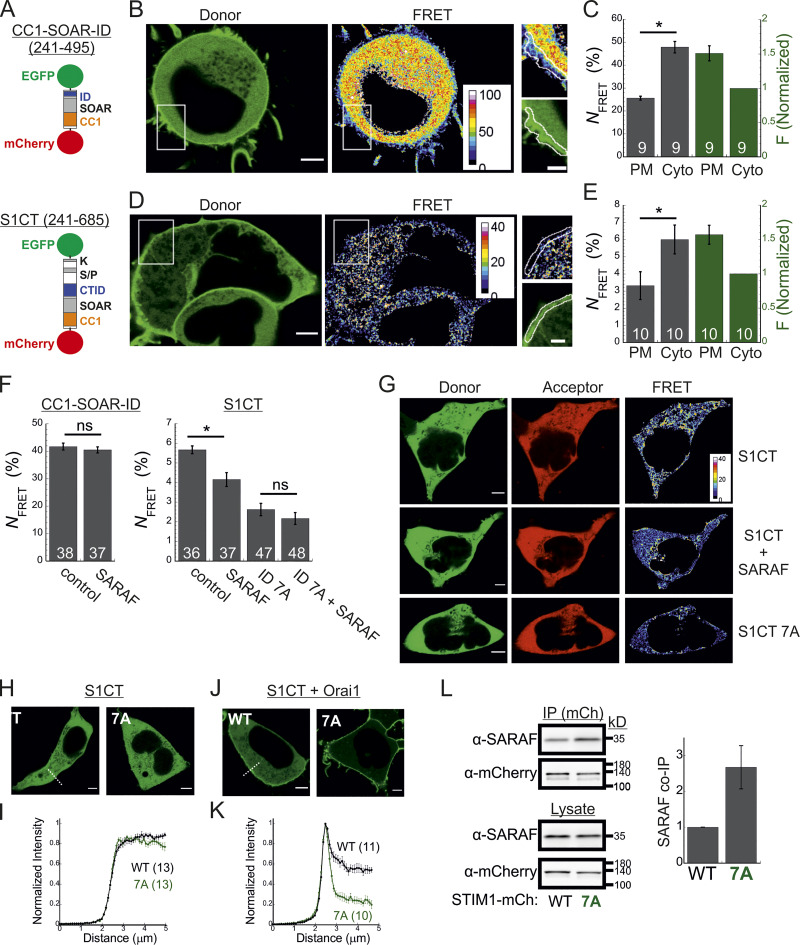
Figure 5.
SARAF promotes a conformational change in the C-terminus of STIM1. (A) Illustration of the two conformational STIM1 sensors used in this work. (B–E) Analysis of conformational changes in the STIM1 CT using FRET sensors. (B and D) Representative images of donor and FRET signals in a cell expressing mCherry-CC1-SOAR-ID-GFP (B) or mCherry-S1CT-GFP (D) together with Orai1. White squares show the regions enlarged on the right. Scale bar, 7 µm (full images) and 2 µm (insets). (C and E) The average FRET and overall sensor fluorescence measured at the PM or cytosol (Cyto). Sensor fluorescence at the PM is normalized to fluorescence recorded in the cytosol. (F) Bar graph shows the averaged FRET for the indicated sensors expressed in SARAF KO cells alone (control) or together with reexpression of SARAF. (G) Representative images of donor, acceptor, and FRET images from SARAF KO cells expressing mCherry-S1CT-GFP, mCherry-S1CT(7A)-GFP, or mCherry-S1CT-GFP together with SARAF. (H–K) Representative fluorescence images (H and J) and summary of normalized intensity values (I and K) across the PM and cytosolic regions (dashed lines indicate representative regions used for analysis) of cells expressing mCherry-S1CT-GFP or mCherry-S1CT(7A)-GFP expressed without (H and I) or together with Orai1 (J and K). Scale bar, 4 µm. (L) WB analysis of cell lysate or immunoprecipitated material (IP using anti-mCherry) prepared from HEK293 SARAF KO cells expressing SARAF without STIM1-mCherry or STIM1(7A)-mCherry. Summary of the relative amount of SARAF in IP material is shown (right) with values normalized to SARAF in total lysate (n = 4). Mean values with SEM are shown in panels C, E, F, I, K, and L, and all numbers in parentheses or within bars for quantification represent the number of cells. P values were calculated with a two-tailed Student’s t test in C, E, and F. *, P < 0.05.

