Figure 7.
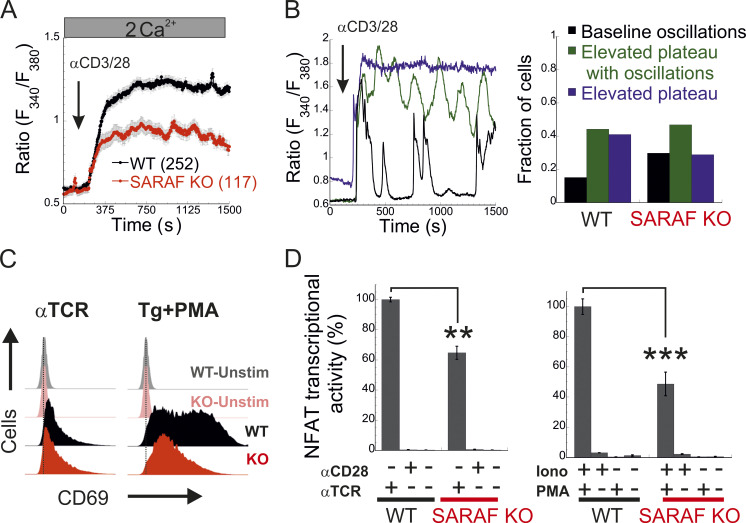
SARAF regulates gene expression by NFAT in T cells. (A) Mean ± SEM intracellular Ca2+ response recorded from WT or SARAF KO Jurkat T cells following stimulation by nanobeads conjugated to α-CD3 and α-CD28 at the indicated time point (WT, n = 252; SARAF KO, n = 117). (B) Left: Representative traces of individual cells showing the time course of the three types of intracellular Ca2+ responses to TCR stimulation: baseline oscillations (black), oscillations with elevated plateau (green), and elevated plateau without oscillations (blue). Right: Bar graph shows the relative distribution of each type of Ca2+ response in WT or SARAF KO cells. (C) Histograms from flow cytometry experiments show the distribution of cells as a measure of α-CD69-FITC fluorescence intensity with or without TCR or TG/PMA (at 1 µM/30 nM, respectively) stimulation, as indicated. (D) JNL cells were stimulated with the indicated combination of α-CD28 and α-CD3 (α-TCR) antibodies (left) or ionomycin (2 µM) and PMA (right), and luciferase activity was used to determine NFAT-regulated gene expression. Bar graph shows the normalized mean ± SEM values obtained from three to six repetitions. P values were calculated using a two-tailed Student’s t test. **, P < 0.01; ***, P < 0.001.

