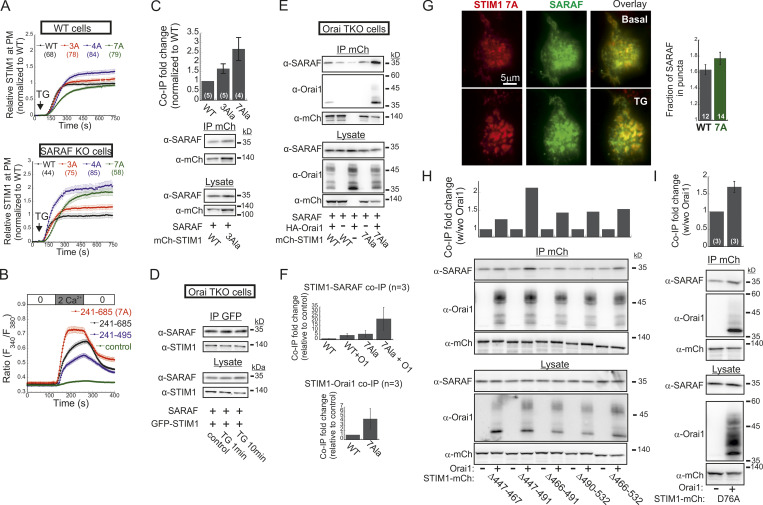
Figure S4.
Effects of mutations in the STIM1 ID, CTID, and EF-hand Ca2+ binding domain of STIM1 on interaction with SARAF or Orai1 and on translocation to ER–PM junctions. (A) The indicated EYFP-STIM1 WT or ID mutants were expressed either in WT (upper panel) or SARAF KO cells (lower panel), and the time course of EYFP fluorescence changes at the PM was recorded following ER Ca2+ depletion by TG (1 µM) for each group of constructs on the same day. The time course of fluorescence change for each construct was normalized to the maximal fluorescence response recorded in control cells (expressing WT STIM1), and the mean ± SEM values of responses for each construct are plotted. (B) Averaged intracellular Ca2+ responses (± SEM) recorded in WT cells expressing HA-Orai1 alone (control, n = 223) or together with mCherry-CC1-SOAR-ID-GFP (aa 241–495, n = 163) or the WT (n = 158) or 7A mutant (n = 69) forms of the mCherry-S1CT-GFP construct (aa 241–685) following addition and washout of Ca2+ (2 mM) in the extracellular solution. (C) WB analysis of cell lysate and protein material following IP of mCherry (mCh) in cells expressing SARAF together with WT or 3A mutant STIM1. Data from Fig. 5 L for STIM1 7A are shown for comparison. (D) WB analysis of cell lysate and protein material following IP of GFP in Orai1 TKO cells expressing SARAF together with EYFP-STIM1 before and after treatment with TG (1 µM) for 1 or 10 min, as indicated. (E) WB analysis of cell lysate and protein material following IP of mCherry in Orai TKO cells expressing SARAF together with either WT or 7A mutant STIM1-mCherry with or without Orai1-HA, as indicated. (F) Summary of the relative amount of SARAF and Orai1 in IP material from Orai TKO cells expressing SARAF, HA-Orai1, and WT or 7A STIM1-mCherry. Values are normalized to those of WT STIM1-mCherry expressing cells ± SEM. (G) Representative TIRF images of a cell expressing STIM1(7A)-mCherry and SARAF-GFP and HA-Orai1 before and after application of TG (400 nM). Right: Quantification of SARAF-GFP fluorescence in STIM1-mCherry or STIM1(7A)-mCherry puncta after TG treatment. Scale bar, 4 µm. (H and I) WB analysis of cell lysate or immunoprecipitated material (IP with anti-mCherry) prepared from HEK293 SARAF KO cells expressing SARAF together with the indicated STIM1-mCherry ΔCTID constructs (H) or with STIM1-mCherry D76A (I) alone or together with HA-Orai1. Top panels show the relative change of SARAF in the IP material following expression of HA-Orai1. All numbers in parentheses or within bars for quantification represent the number of cells.

