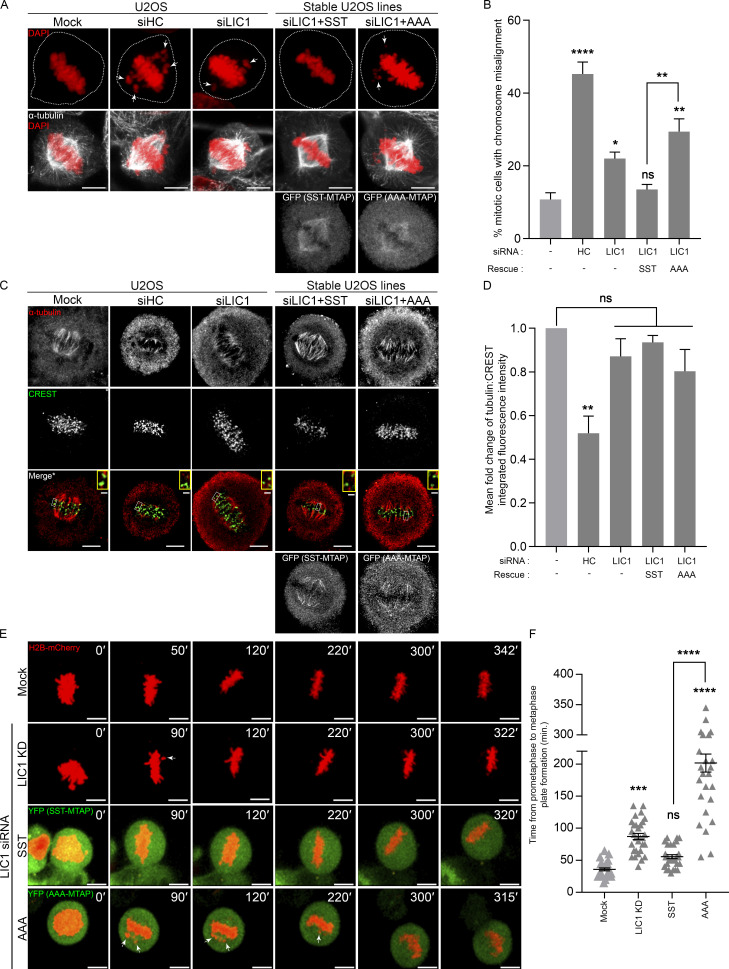
Figure 6.
LIC1-CTD phosphorylation is required for chromosome congression. (A) Representative confocal micrographs showing metaphase chromosome (mis)alignment in U2OS (mock, HC knockdown) or SST-/AAA-U2OS stable cell lines under the indicated conditions. (B) Fraction of miscongressed metaphase cells. n = 3 experiments, 50 cells per experiment. (C) Representative confocal maximum projections from deconvolved planes showing cold-stable microtubules attached to metaphase kinetochores under the indicated conditions. *, Merge: Single z-plane shown from the stack to clearly visualize kinetochore–microtubule attachment; selected kinetochore pairs magnified in insets. (D) Mean fold-change (vs. mock, first bar) of the microtubule (α-tubulin):kinetochore (CREST) integrated fluorescence intensity from metaphase cells upon cold treatment. n = 3 experiments, 20 cells per experiment. (E) Stills from representative time-lapse videos of mitotically synchronized U2OS cells (mock, LIC1 knockdown [KD]) or SST-/AAA-MTAP (green, YFP) stable U2OS cells expressing H2B-mCherry (red), recording the time taken from prometaphase to metaphase plate formation. Time stamps (min) included in the images. (F) Quantification of the timing from prometaphase to metaphase plate formation. n = 2 experiments, 15 mitotic cells per experiment. Arrows, misaligned chromosomes. Cells were released into MG132 after nocodazole treatment for 2 h (fixed cells), and live video imaging was started immediately after MG132 addition. Scale bar = 10 µm, inset scale bar = 1 µm. Error bars = mean ± SEM. *, P < 0.05; **, P < 0.01; ***, P < 0.001; ****, P < 0.0001 (B and D, one-way ANOVA; F, Kruskal–Wallis test).

