Figure S1.
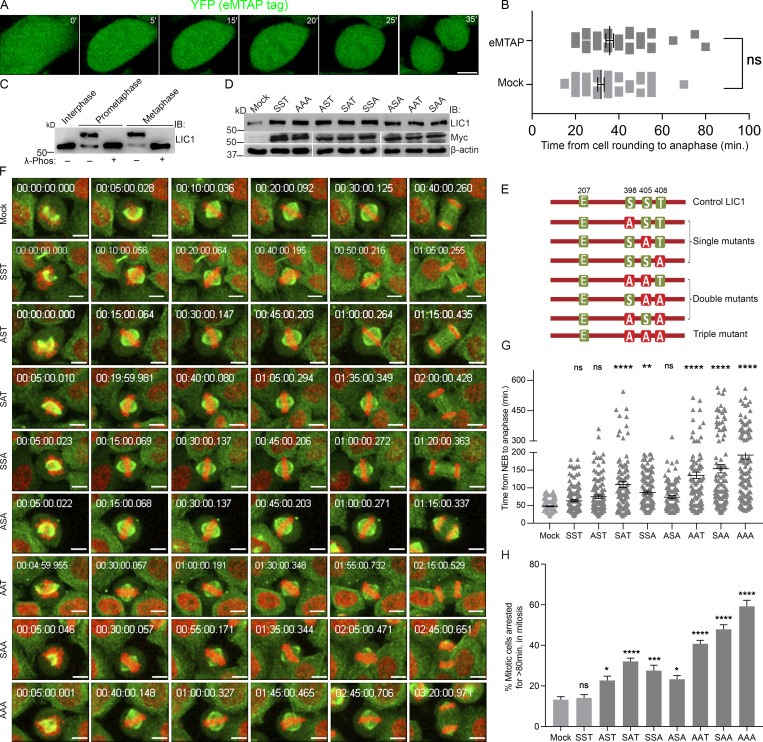
LIC1-CTD phosphorylation is required for proper mitotic progression in HeLa cells. (A) Stills from a time-lapse video of a representative U2OS cell line stably expressing the empty MTAP tag (eMTAP, green). Time stamps included in the images. (B) Graph quantifying the average mitotic timing for eMTAP videos. n = 3 experiments, total 60 mitotic cells imaged. (C) Immunoblots (IB) depicting the migration of hLIC1 from HeLa cell lysates at different stages of the cell cycle as indicated. λ-phos, λ-phosphatase treatment to confirm that the gel retardation is due to phosphorylation. (D) Immunoblots depicting the transient expression of the various rLIC1 phosphorylation constructs shown in E, after transfection into a HeLa cell line expressing GFP-α-tubulin::mCherry-histone 2B. (E) Schematic showing various rLIC1 constructs mutated at the three mitotic CTD cdk1 sites in a mammalian expression vector as indicated. All constructs contained the S207E phosphomimetic mutation. Green boxes, WT residues; red boxes, phosphodeficient mutation to alanine. (F) Stills from representative time-lapse videos of HeLa cells stably expressing GFP-tubulin (green) and mcherry-Histone 2B (red) from NEB to anaphase. Time stamps included in the images. (G) Bar graphs representing the average time taken from NEB to anaphase calculated from the videos as described in F. n = 3 experiments, total 150 mitotic cells imaged. (H) Fraction of mitotic cells showing delayed anaphase onset (>80 min after NEB). Scale bar = 10 µm. Error bars = mean ± SEM. *, P < 0.05; **, P < 0.01; ***, P < 0.001; ****, P < 0.0001, ns = not significant vs. mock. B, two-tailed Student’s t test; G, Kruskal–Wallis test; H, one-way ANOVA.

