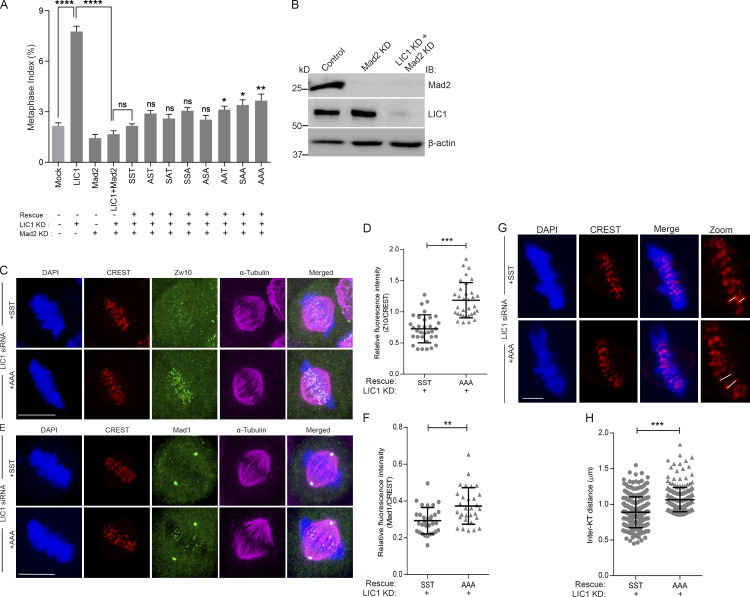
Figure S4.
LIC1-CTD phosphorylation is required for metaphase inactivation of the SAC in HeLa cells. (A) Graph depicting quantification of the metaphase index upon rescue of siRNA-mediated hLIC1 depletion by the various phosphomutant rLIC1 constructs, in the presence (no Mad2 siRNA) and absence (Mad2 siRNA) of a functional SAC. Mock and LIC1 bars are the same data as shown in Fig. S2 C. P values for each of the phosphomutant constructs (sixth bar from the left and beyond) have been calculated with respect to SST. n = 3, ≥500 cells per experiment. (B) Immunoblots (IB) depicting the siRNA-mediated depletion of Mad2 and LIC1 in HeLa cells under the indicated conditions. (C and E) Representative confocal micrographs of congressed metaphase HeLa cells (released from nocodazole into MG132) immunostained to visualize the chromosomes (DAPI, blue), kinetochores (CREST, red), and the indicated SAC proteins, Zw10 or Mad1 (green). All cells were treated with anti-hLIC1 siRNA and rescued by the expression of the indicated rLIC1-CTD constructs. n = 3 independent experiments, ≥30 metaphase cells per condition. Scale bar = 10 µm. (D and F) Scatterplots depicting the quantification of the immunofluorescence signals of SAC proteins Zw10 (D) and Mad1 (F) normalized to the respective kinetochore (CREST) intensities under the indicated conditions. Kinetochore intensities from ≥10 perfectly aligned metaphase cells per experiment over 3 independent experiments were quantified. (G) Representative confocal micrographs of a single z-section of congressed metaphase HeLa cells showing metaphase kinetochores (CREST, red) for calculating interkinetochore distances (white lines) under the indicated conditions. Scale bar = 2 µm. (H) Average interkinetochore distance of cells imaged as in G. n = 3 experiments, a total of 255 kinetochore pairs measured from 10 metaphase cells per experiment for each condition. Error bars = mean ± SD. *, P < 0.05; **, P < 0.01; ***, P < 0.001; ***, P < 0.0001 (two-tailed Student’s t test).

