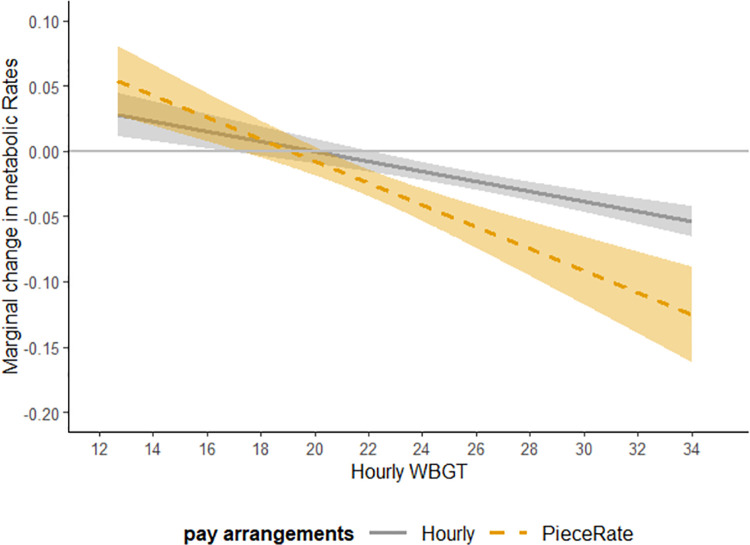
Fig 1. Marginal response in effort with respect to WBGT for workers paid by different pay arrangements based on regression coefficients from Table 5 Column 3.
Note: The solid gray line shows the marginal change in workers’ effort for whom is paid by hourly wages when there is one degree increase in heat exposure. The dotted yellow line shows the marginal change in workers’ effort for whom is paid by piece rates when there is one degree increase in heat exposure. The gray bound around each line shows he 95% confidence intervals.

