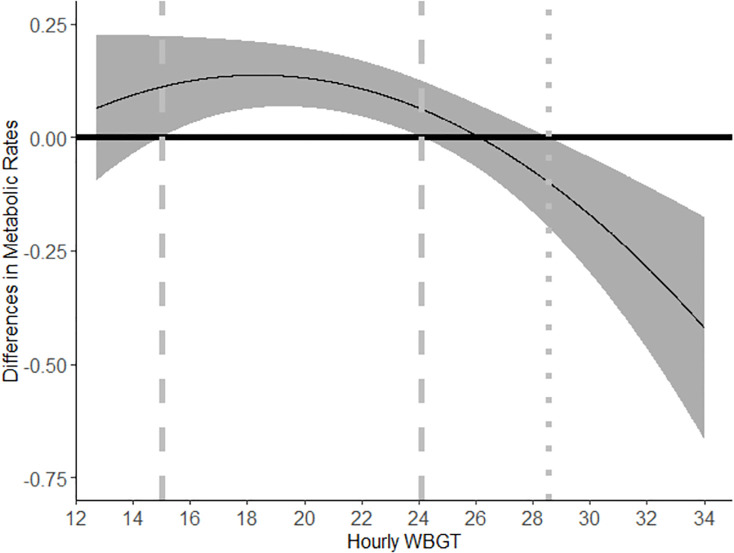
Fig 2. Differences in effort between workers paid by piece-rate arrangements and hourly wages in response to WBGT based on regression coefficients from Table 5 Column 3.
Note: The solid line curve shows the differences in worker effort between workers paid by different schemes. The gray area shows the 95% confidence interval of the metabolic differences. The dot-dashed lines show the cut-off points of hourly WBGT where the estimated 95% confidence interval of the differences in metabolic rates between workers paid by piece rate and hourly rate is above zero. The dashed lines show the cut-off points of hourly WBGT where the estimated 95% confidence interval of the differences in metabolic rates between workers paid by piece rate and hourly rate is below zero.

