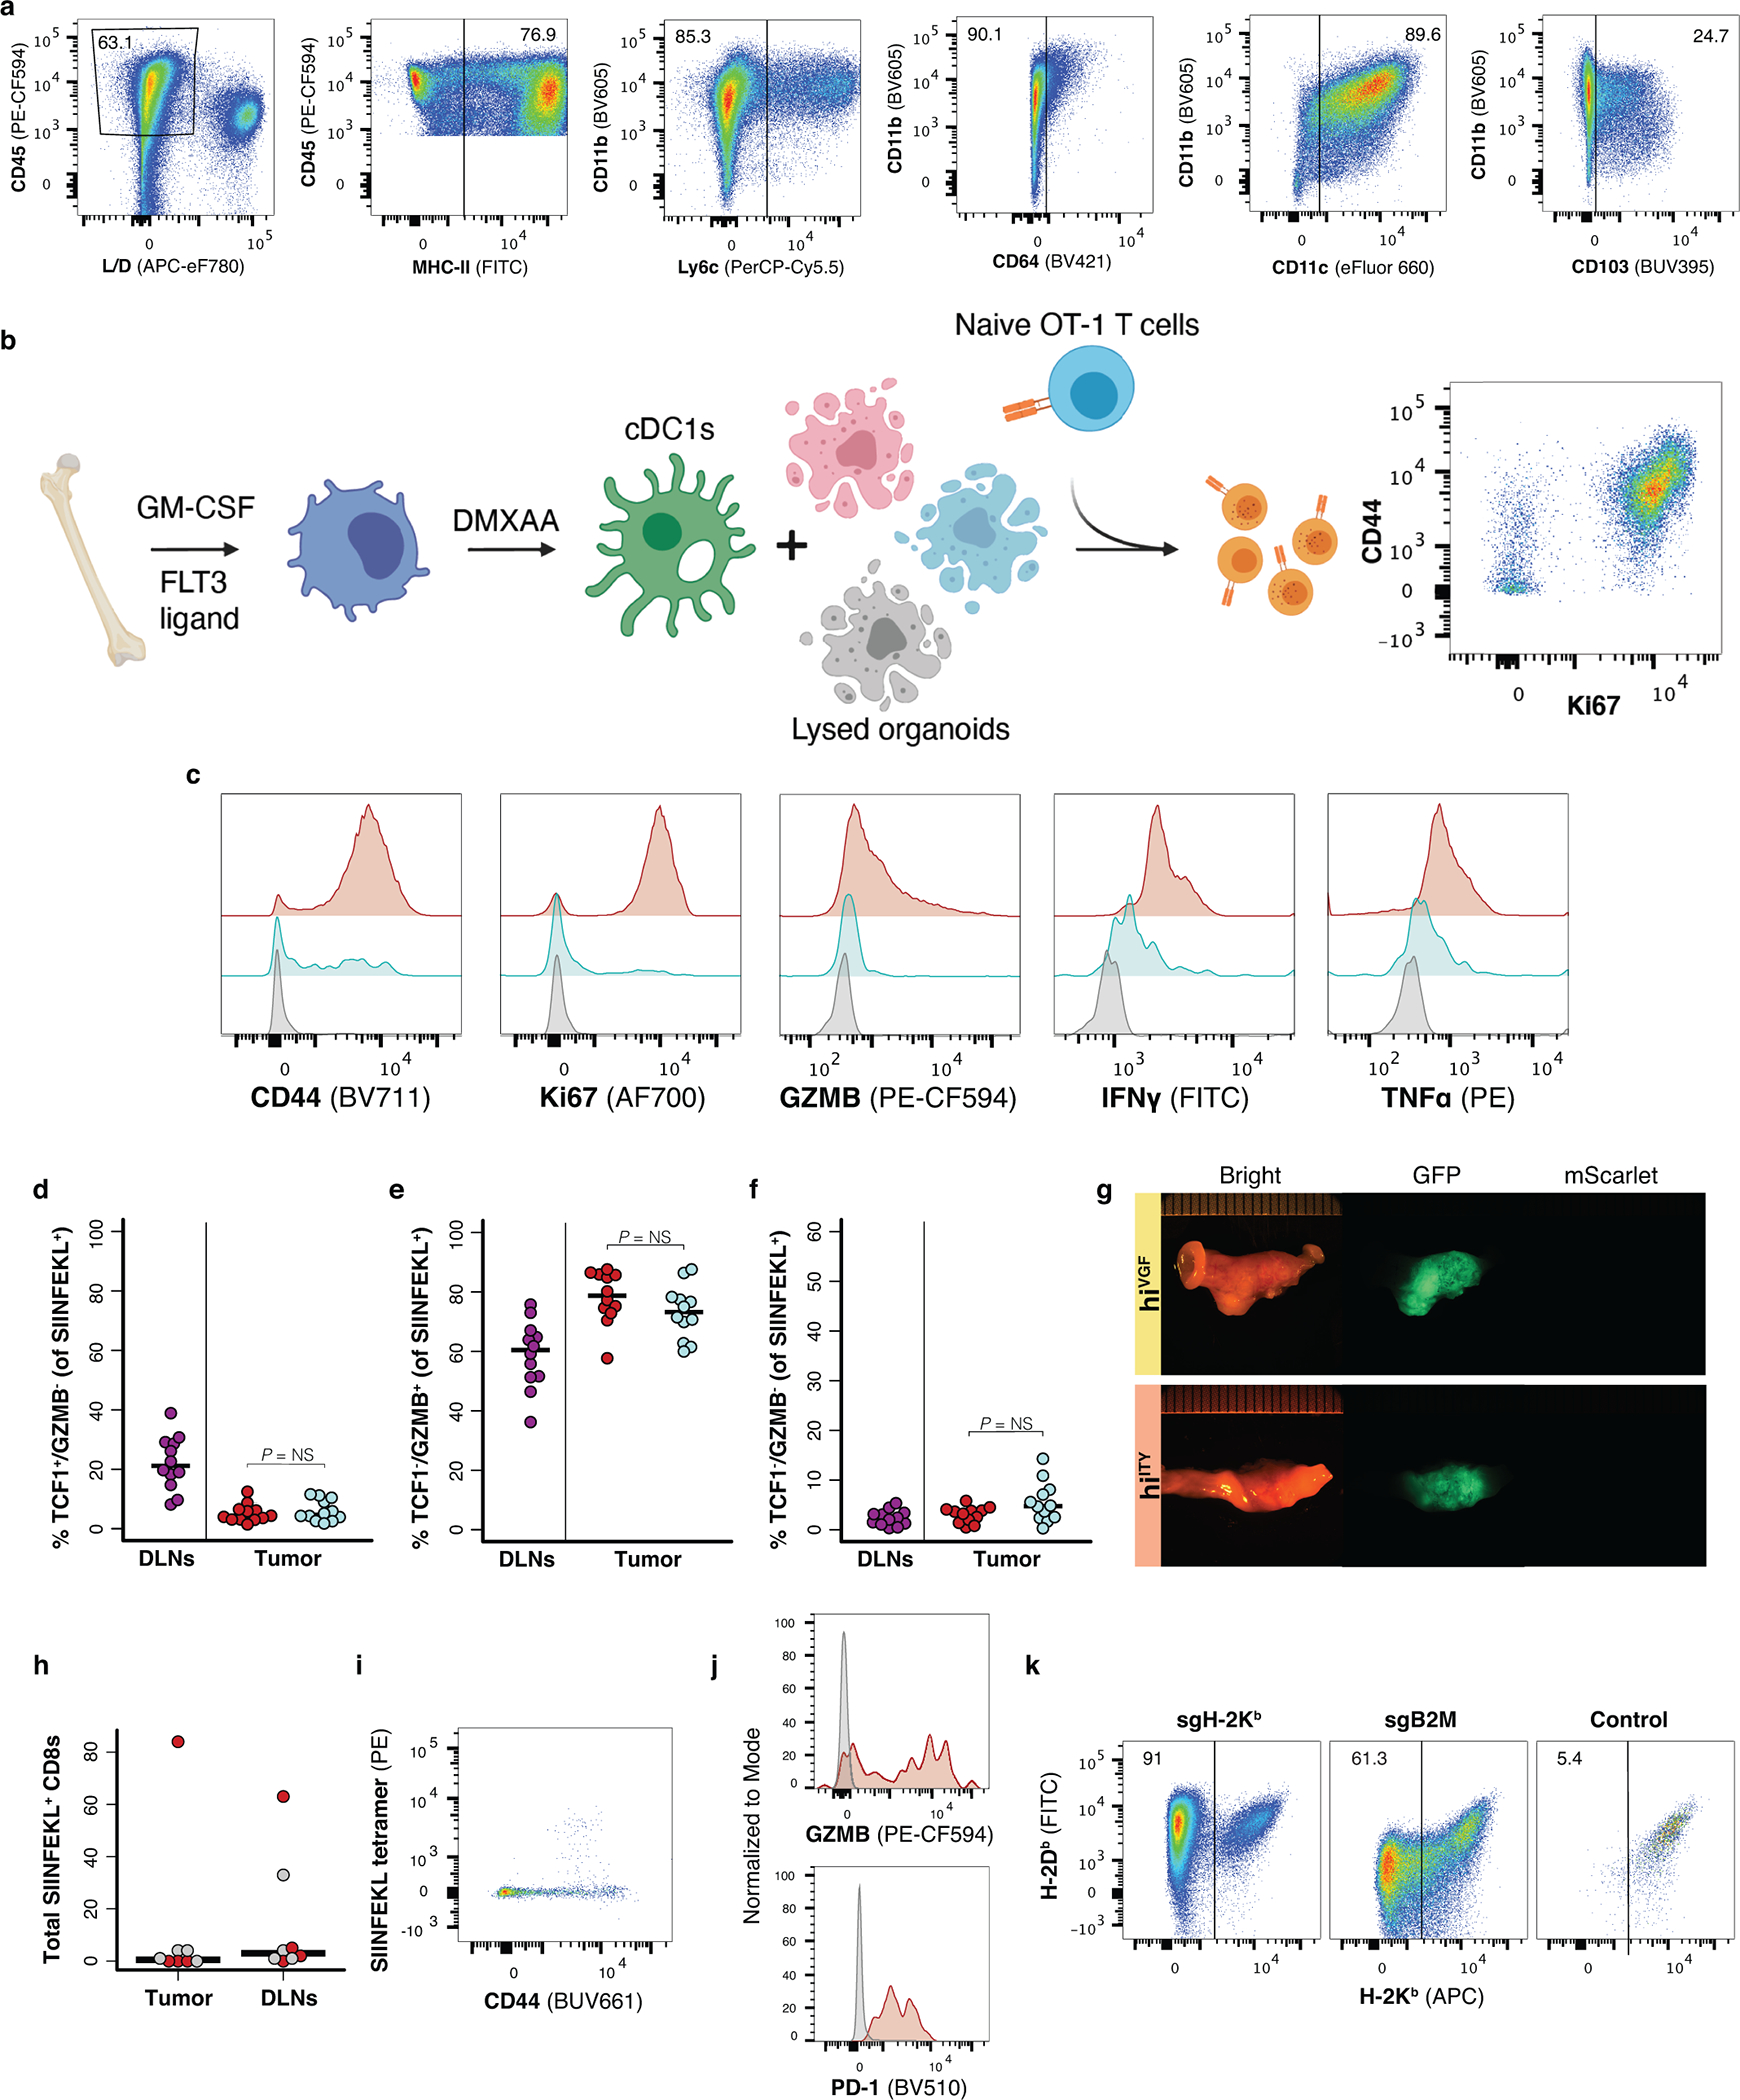
Extended Data Fig. 5: Neoantigen expression is limiting for cross priming by canonical and noncanonical antigen-presenting cells.

(a) Flow cytometry gating strategy to determine percentage of CD11c+/CD103+ DC1s in BM-DC culture. (b) Schematic of BM-DC isolation, activation, and co-culture with naïve OT-1s. (c) Histograms of CD44, Ki67, GZMB, TNFα, and IFNγ expression on OT-1s representative of N = 4 co-cultures in the 400,000 lysed organoid cells condition. (d-f) Flow cytometric analysis of antigen-specific T cells from DLNs and lesions 8 days post-co-transplant of hiSIIN (red) and loSIIN (blue) organoids at separate sites. Percent TCF1+/GZMB- (d), TCF1-/GZMB+ (e), and TCF1-/GZMB- (f). N = 12 animals. Significance assessed by two-tailed Wilcoxon Rank Sum. (g) Brightfield and fluorescent images of colons and tumors 6 weeks post co-transplant of loSIIN and hiVGF or hiITY, representative of N = 9 animals each. (h-j) Flow cytometric analysis of antigen-specific (CD44+/SIINFEKL+) CD8s in colon and DLNs 6 weeks post-transplant of hiSIIN in Batf3−/− mice. (h) Total SIINFEKL+ CD8s, with progressive tumors in grey (N = 4 animals) and rejected lesions in red (N = 4 animals). (i) Flow plot of SIINFEKL+ CD8s infiltrating rejected lesion, and (j) PD-1 and GZMB expression on CD44+/SIINFEKL+ CD8s (red) versus CD44- CD8s (grey) from rejected lesion representative of N = 4 animals. (k) Flow plots of H-2Kb/H-2Db expression on hiSIIN organoids post electroporation with Cas9 complexes targeting H2-k1 and B2m, or untargeted control (pre-sorting). Organoids were pre-treated with IFNγ. N = 1 experiment. Source data for panels (d-f) can be found in Source Data Figure 5j.
