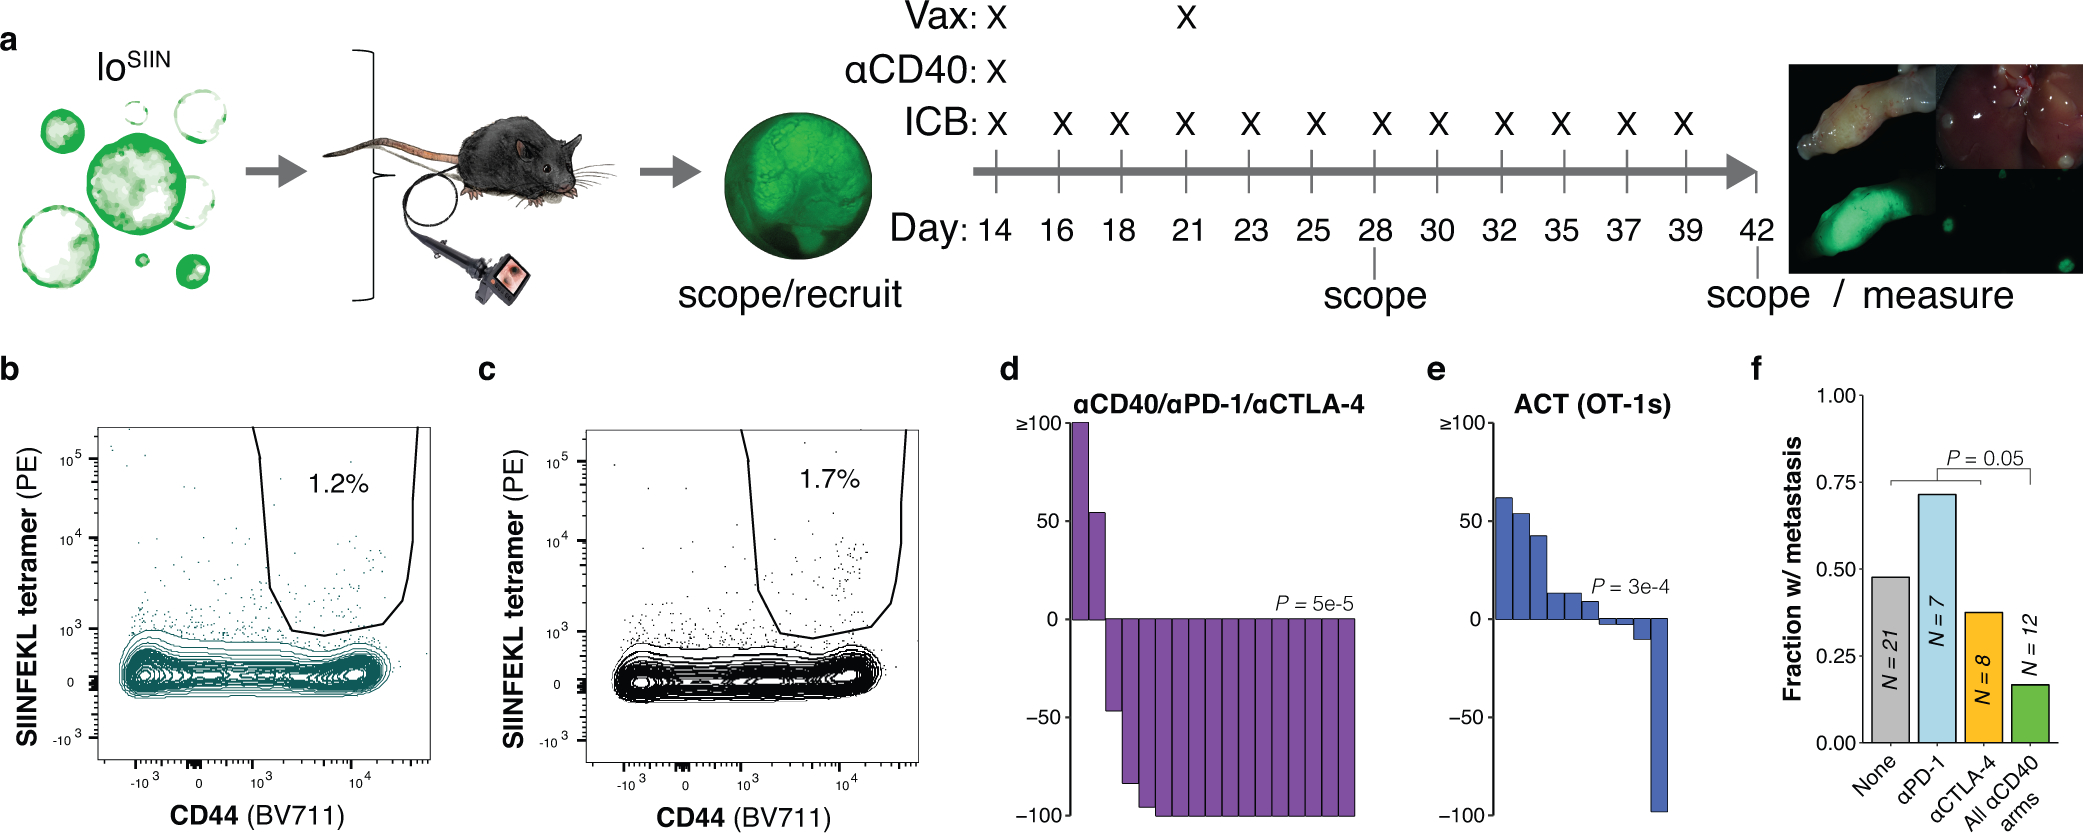
Extended Data Fig. 6: Design of preclinical trials to test therapies that rescue priming in low neoantigen expressing tumors.

(a) Schematic of vaccination and immunotherapy preclinical trial design and dosing schedule. (b-c) Flow plots of peripheral blood antigen-specific (CD44+/SIINFEKL tetramer+) CD8+ T cells from non-specific peptide-based vaccination (b) and no vaccination control (c) mice, representative of N = 7 and 8 independent animals, respectively. (d-e) Change in tumor size after 14 days of treatment, as determined by colonoscopy. ACT = adoptive cell transfer of OT-1s. N = 17 (d) and 10 (e) independent animals. Significance assessed by Wilcoxon Rank Sum of percent change in tumor size of treatment group versus no treatment, with Holm’s correction. (f) Fraction of mice with any metastases (liver, lung, or omentum), including only mice with progressive primary disease. N = independent animals. Significance assessed by 2×2 Fisher’s exact test of number of mice with metastases across all αCD40 treatment arms (with and without ICB) versus all other arms (no treatment and ICB single agent arms). Source data for panels (d-e) can be found in Source Data Figure 6e–j, m.
