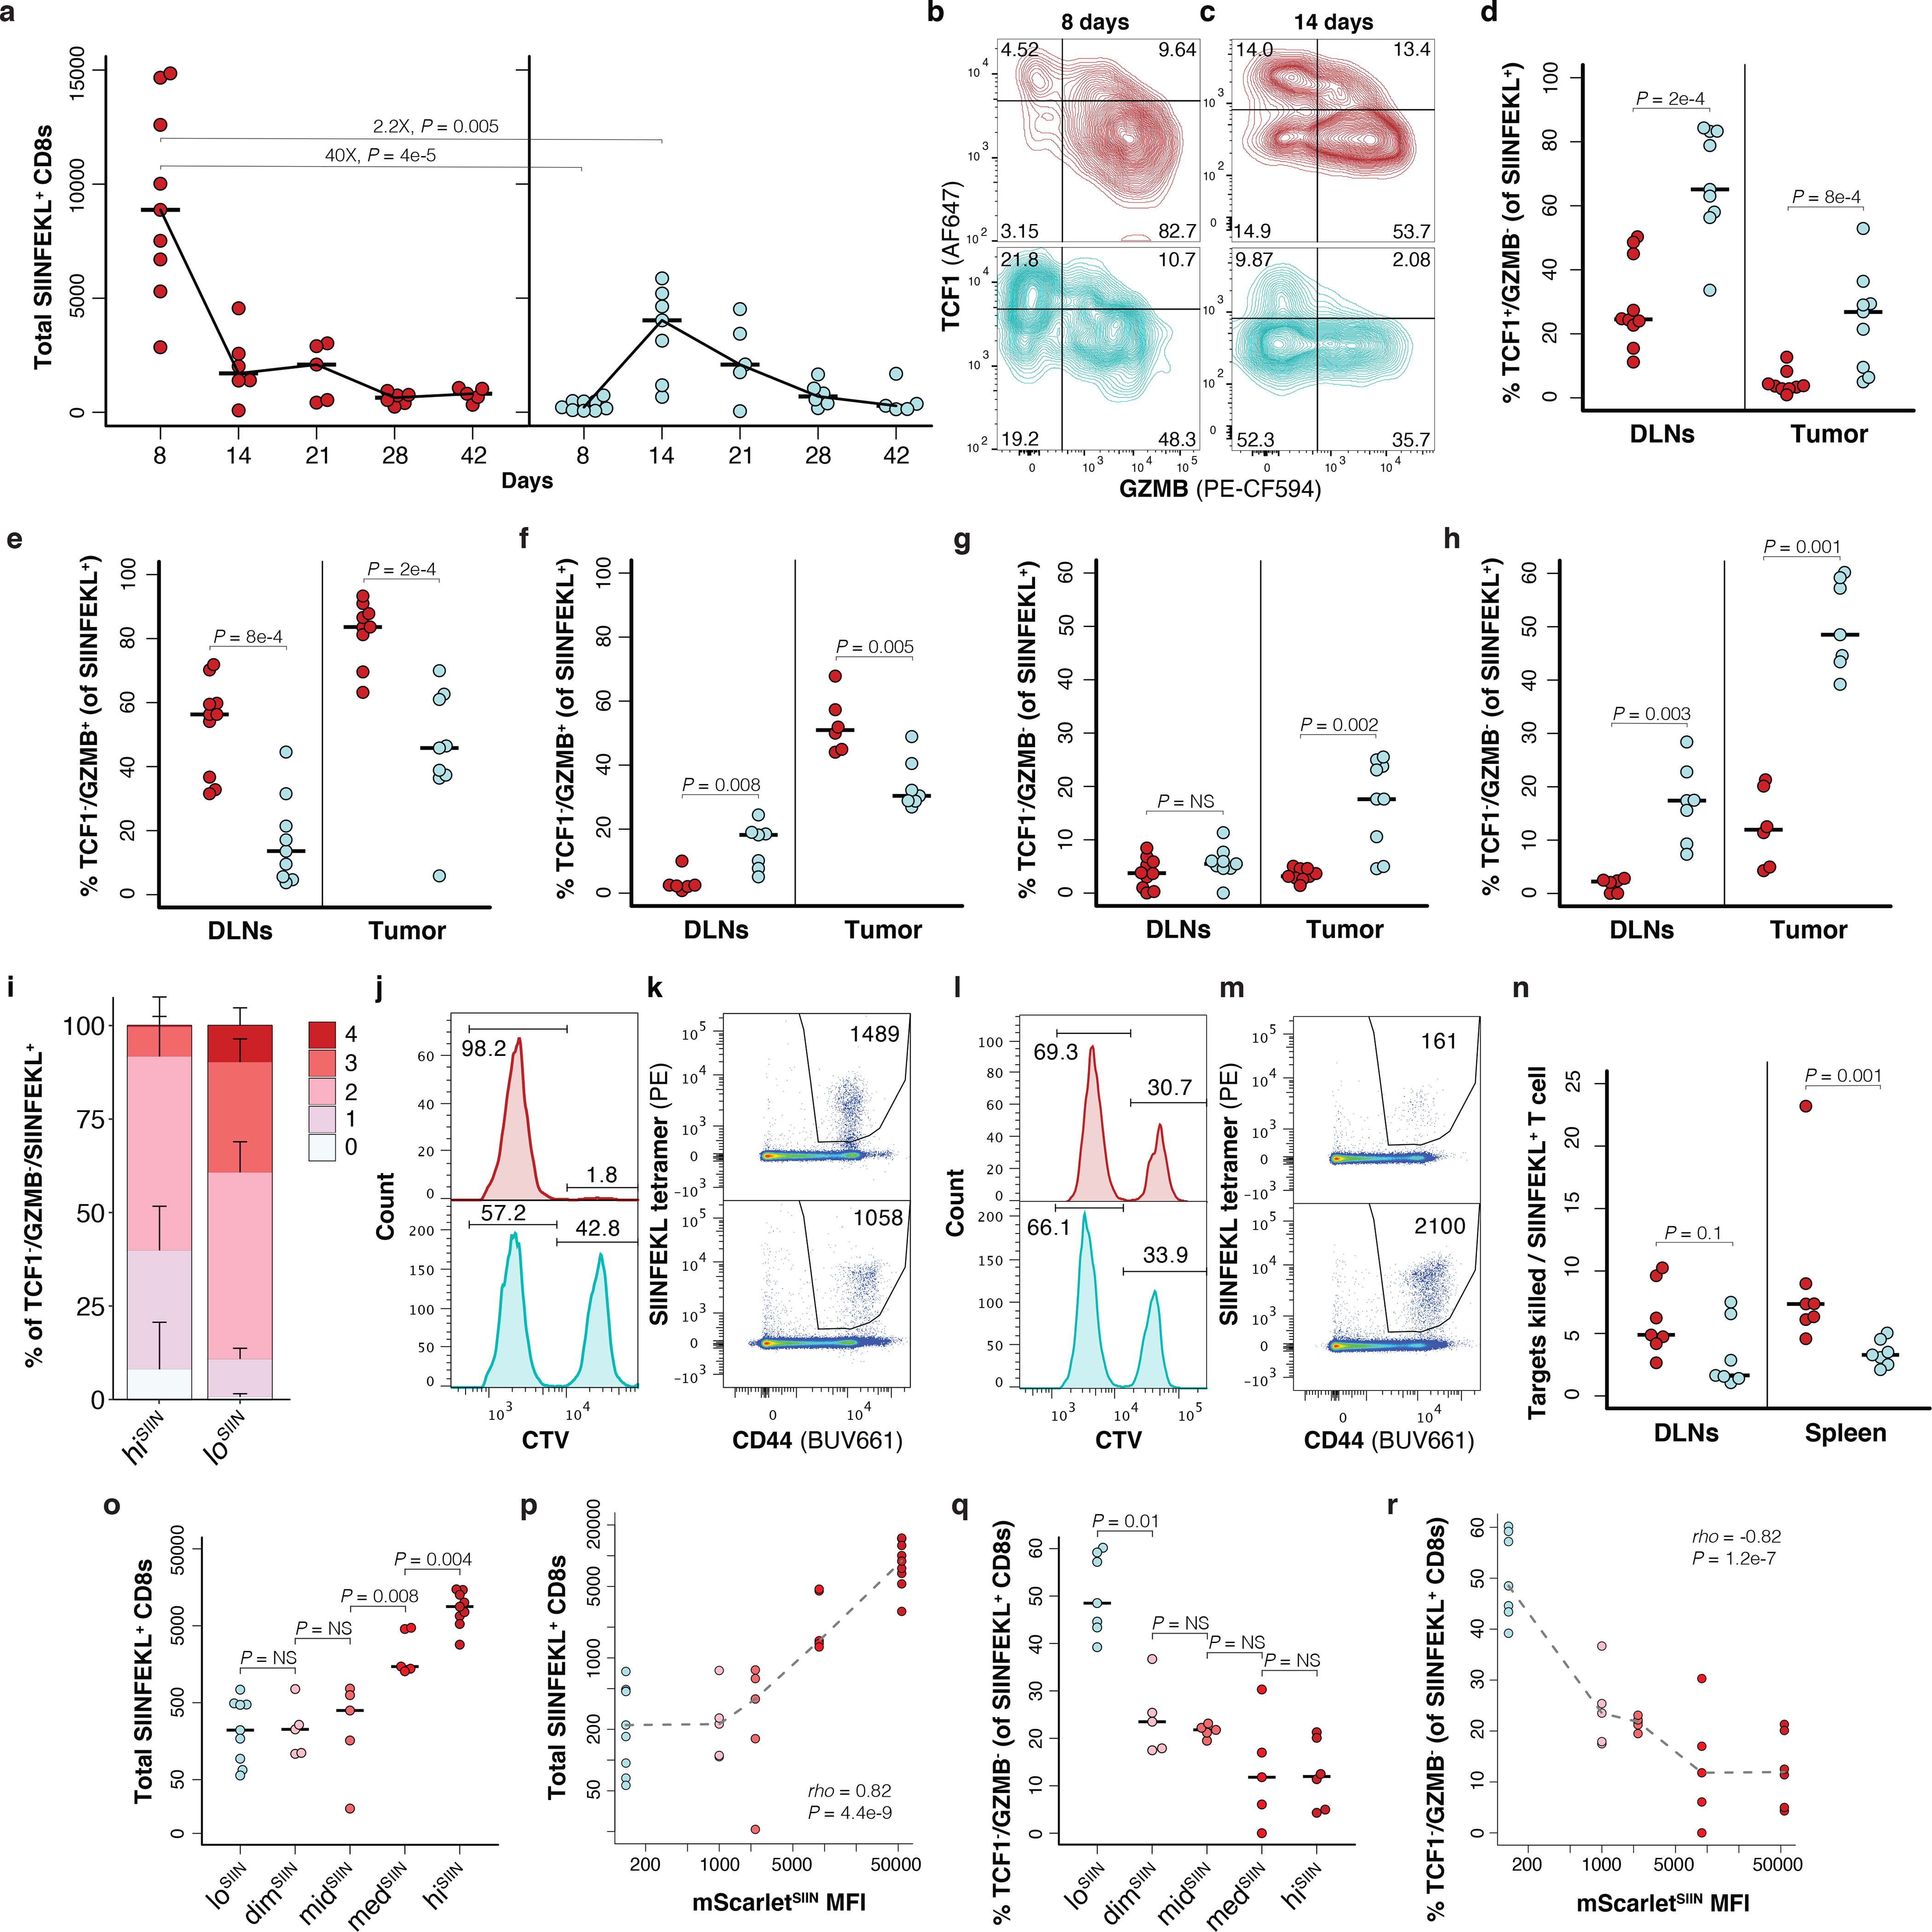
Figure 3.

Low neoantigen expression drives impaired T cell effector commitment and dysfunction. (a) Total CD44+/CD8+ antigen-specific T cells isolated from lesions at indicated days post-transplant of hiSIIN (red) and loSIIN (blue) organoids by flow cytometry. N = 5–9 independent animals per line and timepoint. (b-c) Antigen-specific T cell expression of TCF1 versus GZMB in tumors at 8 (b) and 14 (c) days. Representative of animals in (a). (d-e, g) Percent of antigen-specific T cells from DLNs and tumors at 8 days positive for TCF1 and negative for GZMB (d), negative for TCF1 and positive for GZMB (e), and double-negative for TCF1 and GZMB (g). N = 10 hiSIIN and 9 loSIIN-transplanted animals. (f,h) Percent of antigen-specific T cells from DLNs and tumors at 14 days negative for TCF1 and positive for GZMB (f), and double-negative for TCF1 and GZMB (h). N = 6 hiSIIN and 7 loSIIN-transplanted animals. (i) Median percentage of TCF1-/GZMB- antigen-specific T cells from tumors at 14 days co-expressing 0 through 4 inhibitory receptors (PD-1, TIM3, LAG3, and 2B4). N = 6 hiSIIN and 7 loSIIN-transplanted mice. Bars = standard deviation. (j-m) In vivo killing assay of transferred control (weak CTV stain) and SIINFEKL-loaded “target” (strong CTV stain) splenocytes and flow plots of antigen-specific T cells recovered from DLNs at 8 (j-k) and 14 (l-m) days post-transplant of hiSIIN (red) and loSIIN (blue) organoids. Representative of N = 6–7 independent animals per line and timepoint. (n) Target killing normalized to total antigen-specific T cells recovered in 14-day killing assay. N = 7 independent animals per line. (o-p) Total antigen-specific T cells isolated from lesions at 8 days across all expression variant lines (o) and versus mScarletSIIN MFI (p). (q-r) Percent of TCF1-/GZMB- antigen-specific T cells from 14-day lesions across expression variants (q) and versus mScarletSIIN MFI (r). Dashed lines connect medians. Significance assessed by Spearman’s rank correlation. N = 5–9 independent animals per line in (o-r). Significance in (a), (d-h), (n-o), and (q) assessed by two-tailed Wilcoxon Rank Sum. Holm’s correction applied in (o) and (q).
