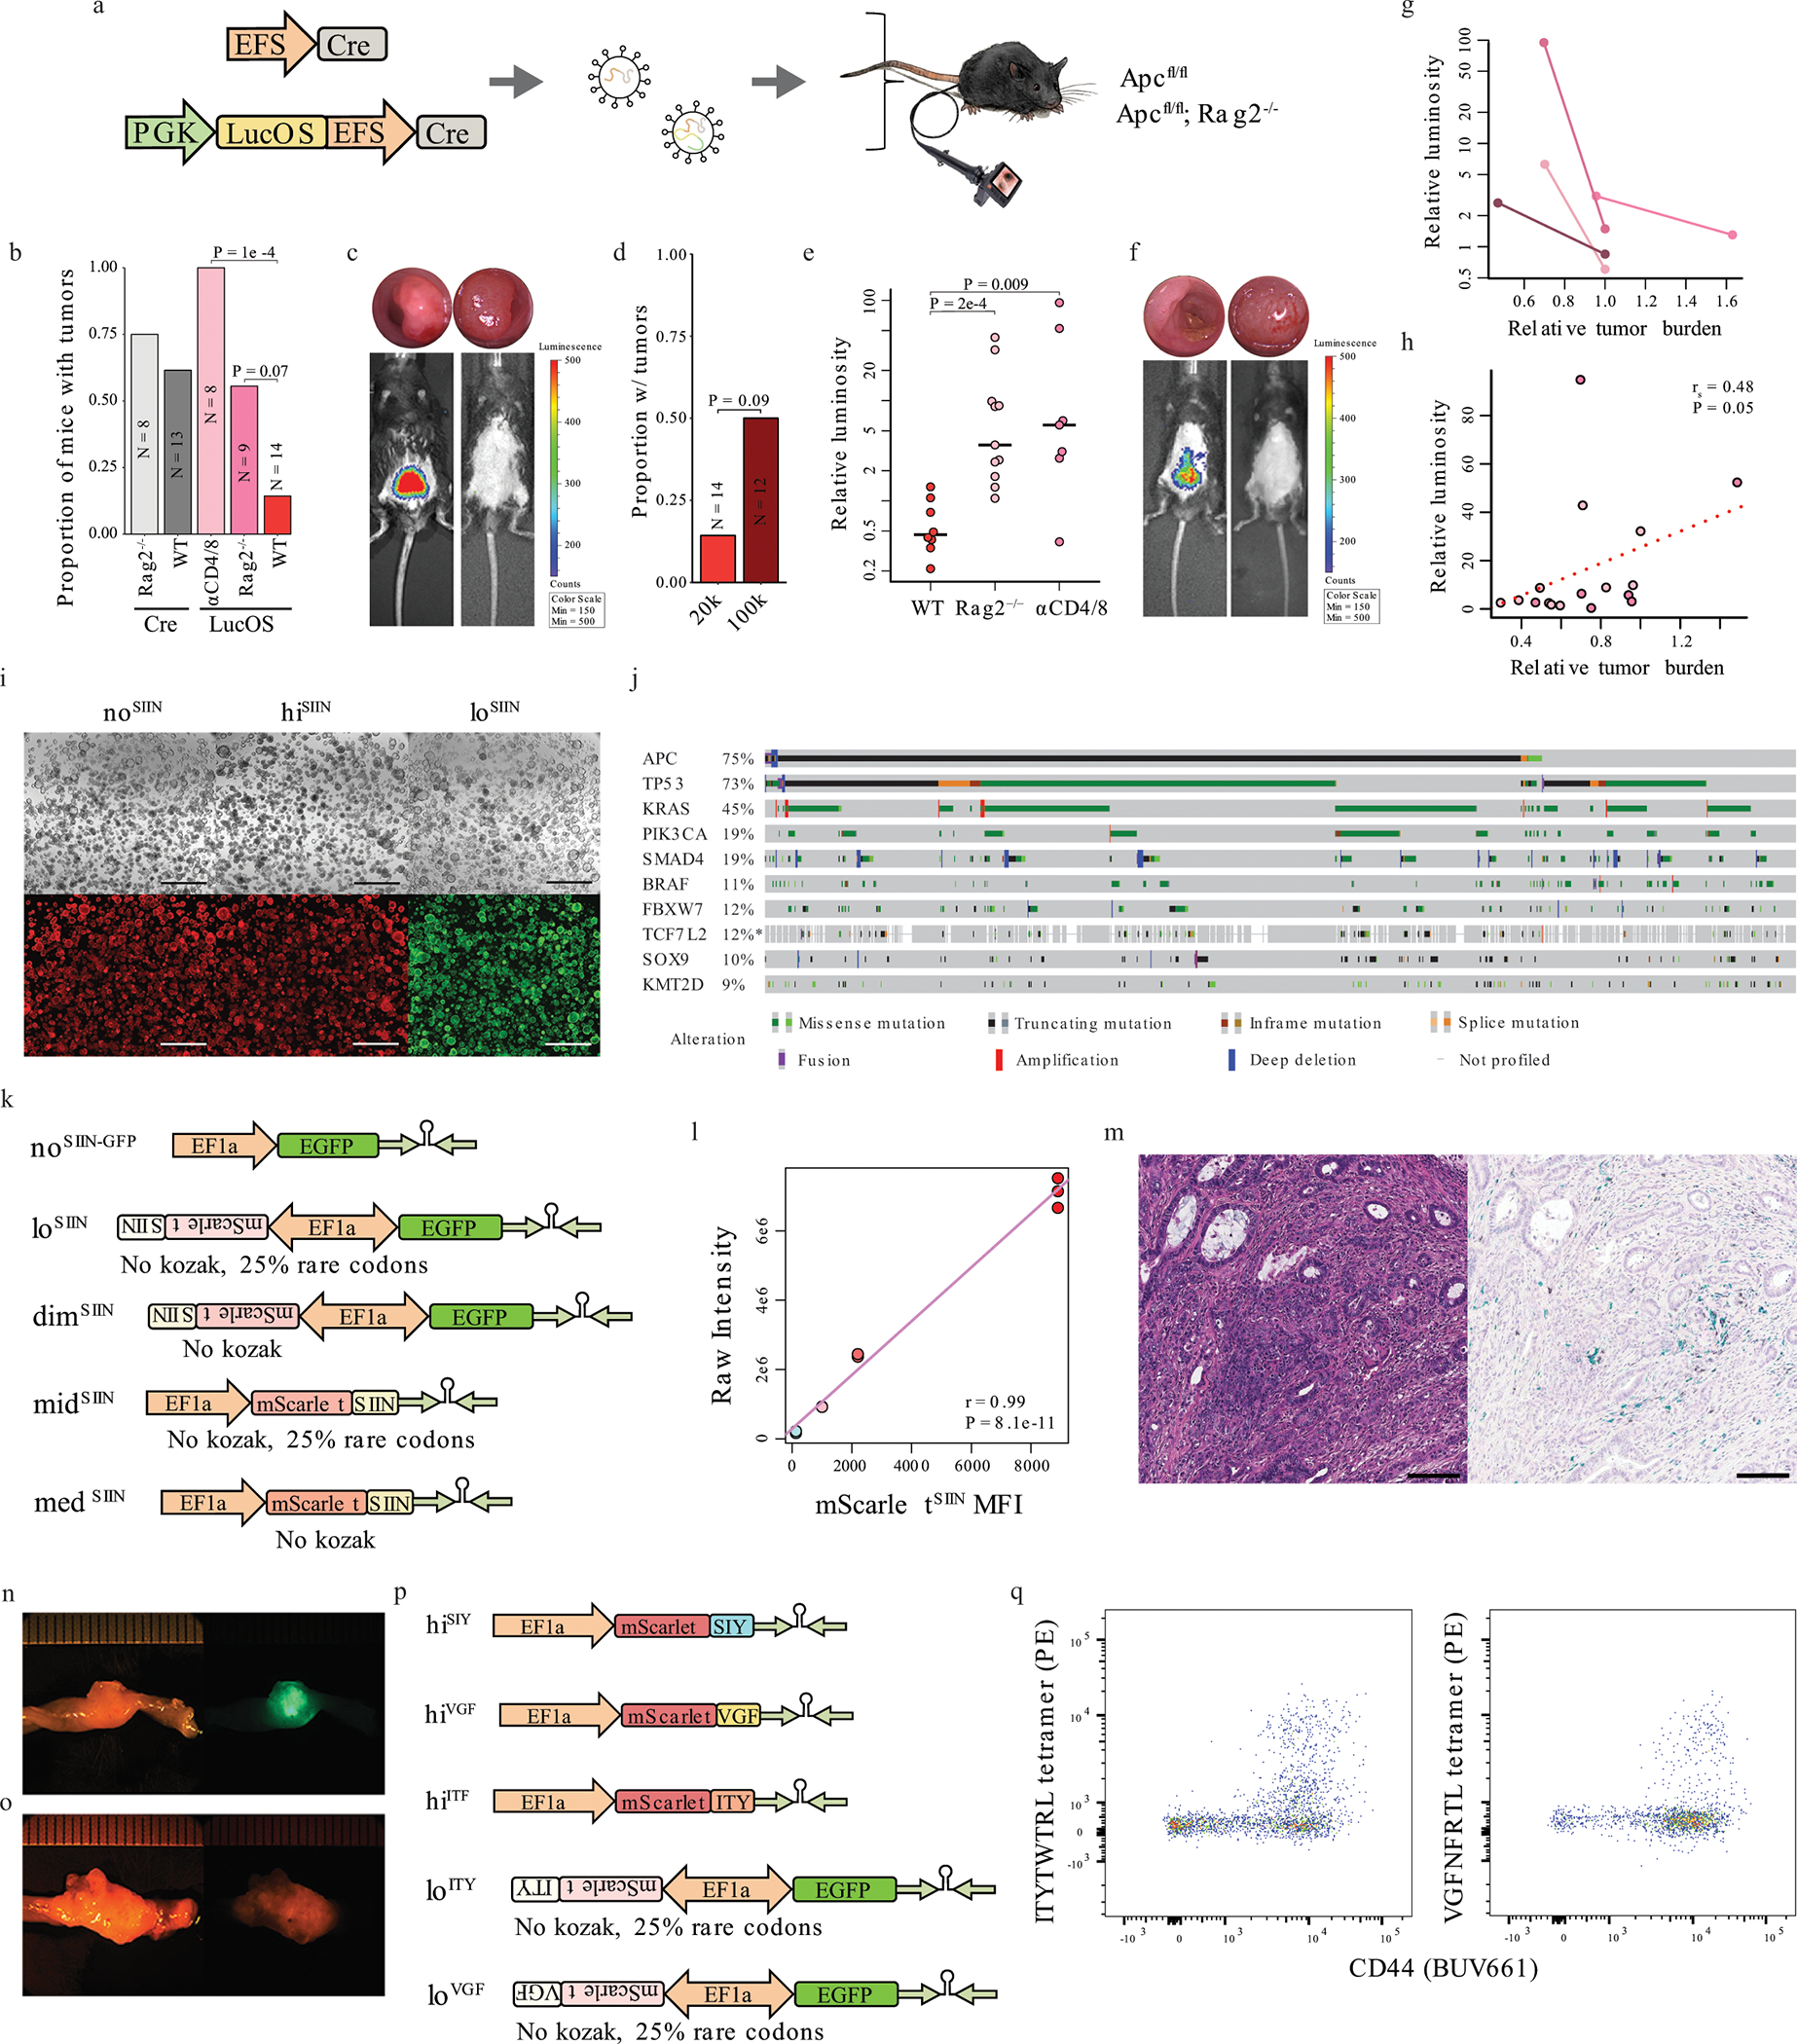
Extended Data Fig. 2: Development of in vivo lentiviral and organoid models of CRC with neoantigen expression.

(a) Lentiviruses used to initiate colon tumors in Apcflox/flox and Apcflox/flox; Rag2−/− mice. (b) Efficiency of tumor formation 16 weeks post-injection. N = independent animals. Significance assessed by two-tailed Wilcoxon Rank Sum with Holm’s correction for multiple comparisons. (c) Antigen expression in LucOS-induced tumors in Rag2−/− (left) and wild-type (right) mice at 12 weeks (colonoscopy above, bioluminescence below). (d) Efficiency of tumor induction with LucOS lentivirus at 20,000 and 100,000 transduction units (TU)/μl. N = 26 independent animals. (e) Antigen expression (bioluminescence). N = 26 independent animals. Significance assessed by two-tailed Wilcoxon Rank Sum. (f) Antigen expression in LucOS-induced tumors with continuous T cell depletion at 5 weeks (left) and 7 weeks after T cell depletion (right), and colonoscopy (above). (g) Antigen expression versus relative tumor size (percent of colon occluded) following withdrawal of depleting antibodies. N = 4 independent animals. (h) Correlation of antigen expression and tumor burden in Rag2−/− (dark pink) and αCD4/8 (light pink)-treated mice 12 weeks post-injection with LucOS. N = 17 independent animals. Significance measured by Spearman’s rank-order correlation. (i) noSIIN, hiSIIN, and loSIIN organoids grown in the absence of WNT. Scale bars = 1 mm. Representative of N = 3 independent cultures. (j) Top 10 mutated genes in MSK-IMPACT colon adenocarcinoma (cBioPortal). (k) Lentiviral constructs used to generate organoids expressing only EGFP (noSIIN-GFP) and SIINFEKL expression variants. (l) Linear regression with Pearson correlation of SIINFEKL abundance (TMT-MS) versus mScarletSIIN MFI (flow cytometry). TMT-MS was performed on three independent preparations of each line. (m) H&E and IHC of noSIIN primary colon tumor 42 days post-transplant. Representative of N = 9 independent animals. Scale bar = 100 μM. (n-o) Images of dimSIIN (n) and midSIIN (o) tumors that formed in N = 2/9 and 1/9 transplanted animals, respectively. (p) Lentiviral constructs used to generate organoids expressing SIYRYYGL, ITYTWTRL, and VGFNFRTL at high and low levels. (q) ITYTWTRL and VGFNFRTL tetramer-specific CD8+ T cells infiltrating 42-day loITY and loVGF tumors by flow cytometry. Representative of N = 10 loITY and 9 loVGF transplanted animals.
