. 2021 Sep 29;10:e69298. doi: 10.7554/eLife.69298

Figure 2. Effects of fire-sourced PM2.5, estimated by linear models.

The dots with error bars show the estimated associations between gestational exposure to fire-sourced PM2.5 and birthweight change, low birthweight, or very low birthweight. The dots represent the point estimates, and bars represent the corresponding 95% confidence intervals.

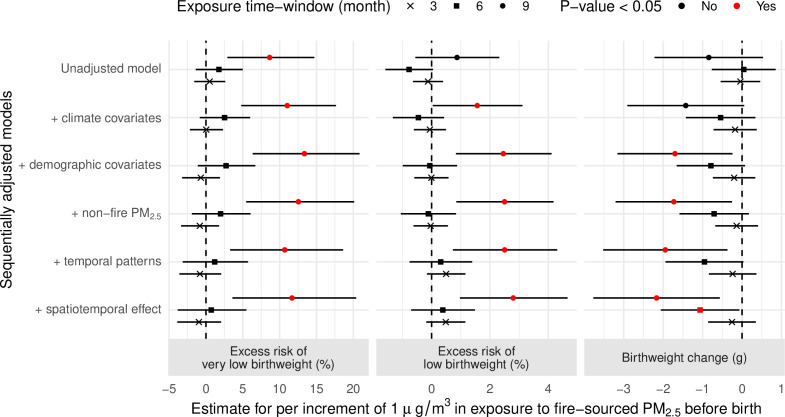
Figure 2.

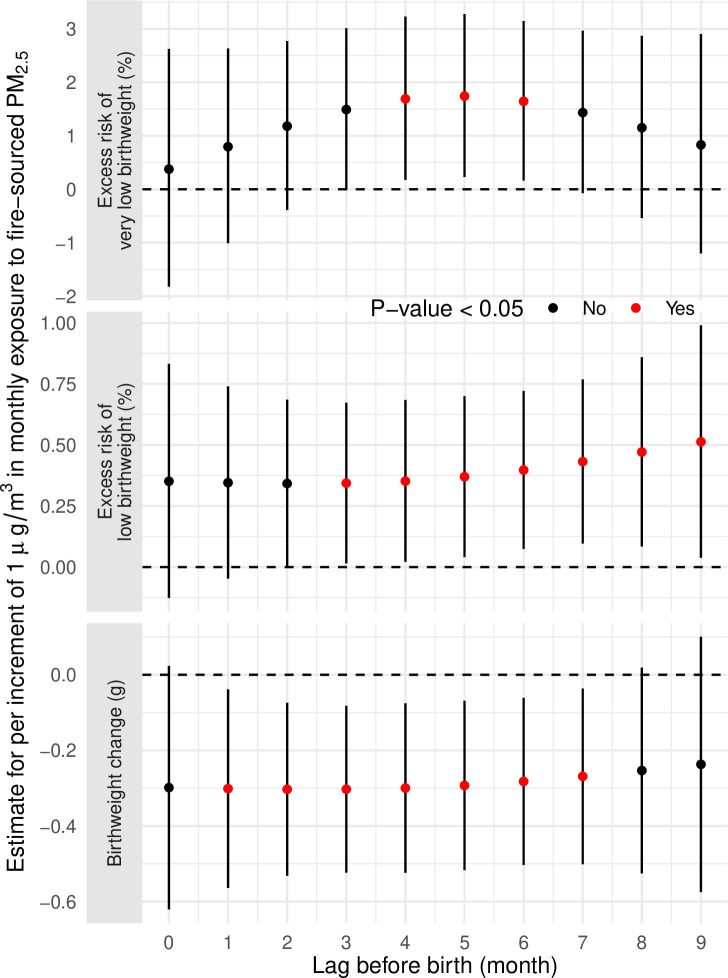
Figure 2—figure supplement 1. The estimated associations between fire-sourced PM2.5 and birthweight change, low birthweight or very low birthweight, by different lags.

Figure 2—figure supplement 1.

The nth lagged exposure is defined as the concentration of fire-sourced PM2.5 during the nth month before birth. The results are estimated from the lag-distributed models.
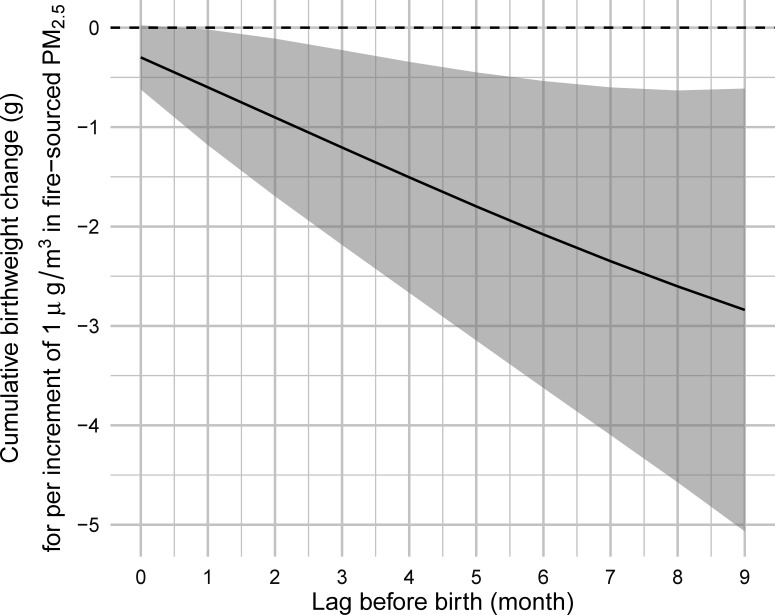
Figure 2—figure supplement 2. The cumulated birthweight change associated with an average of fire-sourced PM2.5 concentrations from a lagged month to birth.

Figure 2—figure supplement 2.

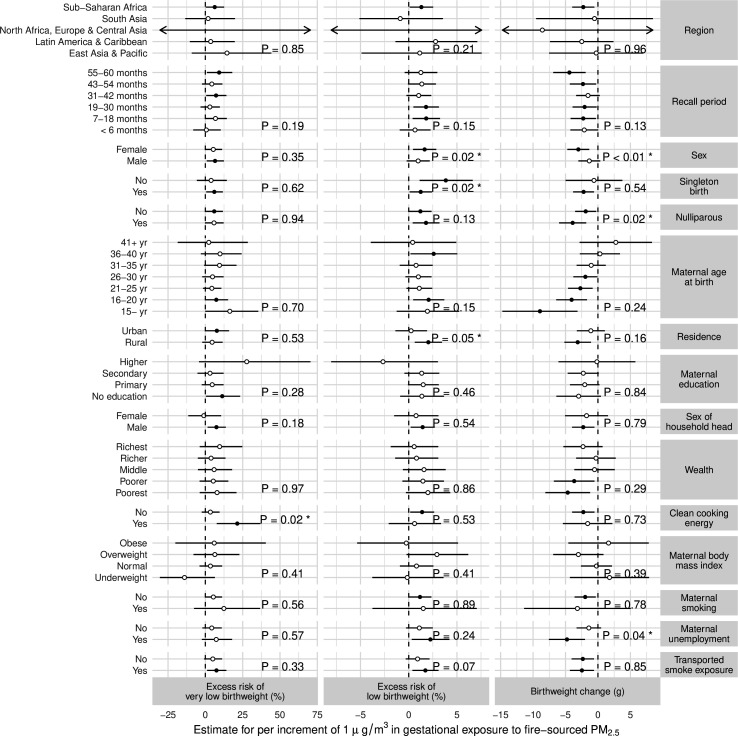
Figure 2—figure supplement 3. The subpopulation-specific associations between gestational exposure to fire-sourced PM2.5 and birthweight change, low birthweight and very low birthweight.

Figure 2—figure supplement 3.