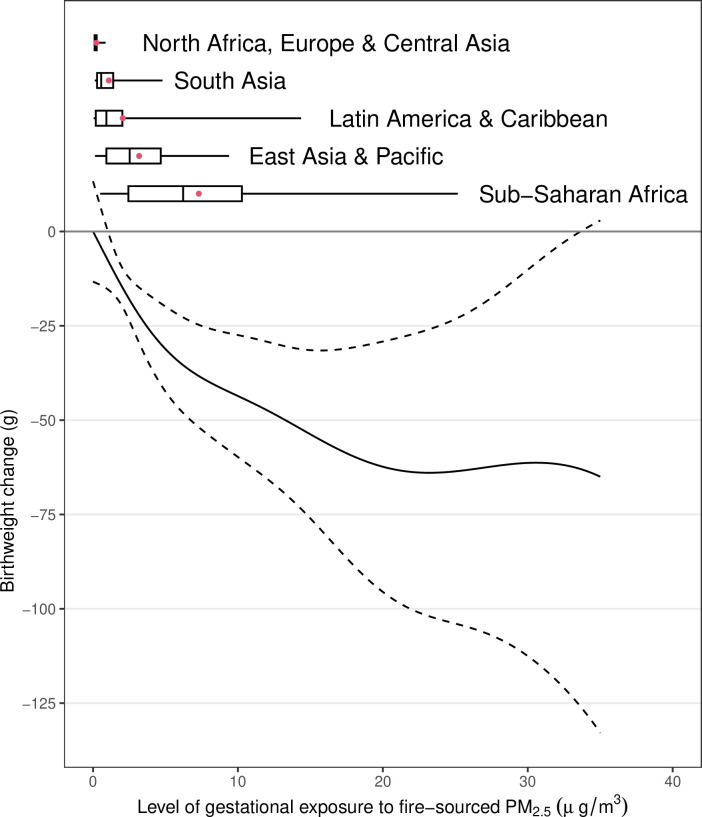
Figure 3. The nonlinear association between gestational exposure to fire-sourced PM2.5 and change in birthweight.
The solid line represents the point estimates, the dashed line represents the 95% confidence intervals, the boxplots represent the distributions of different exposure levels by regions, and the red dots represent the mean exposure level.

