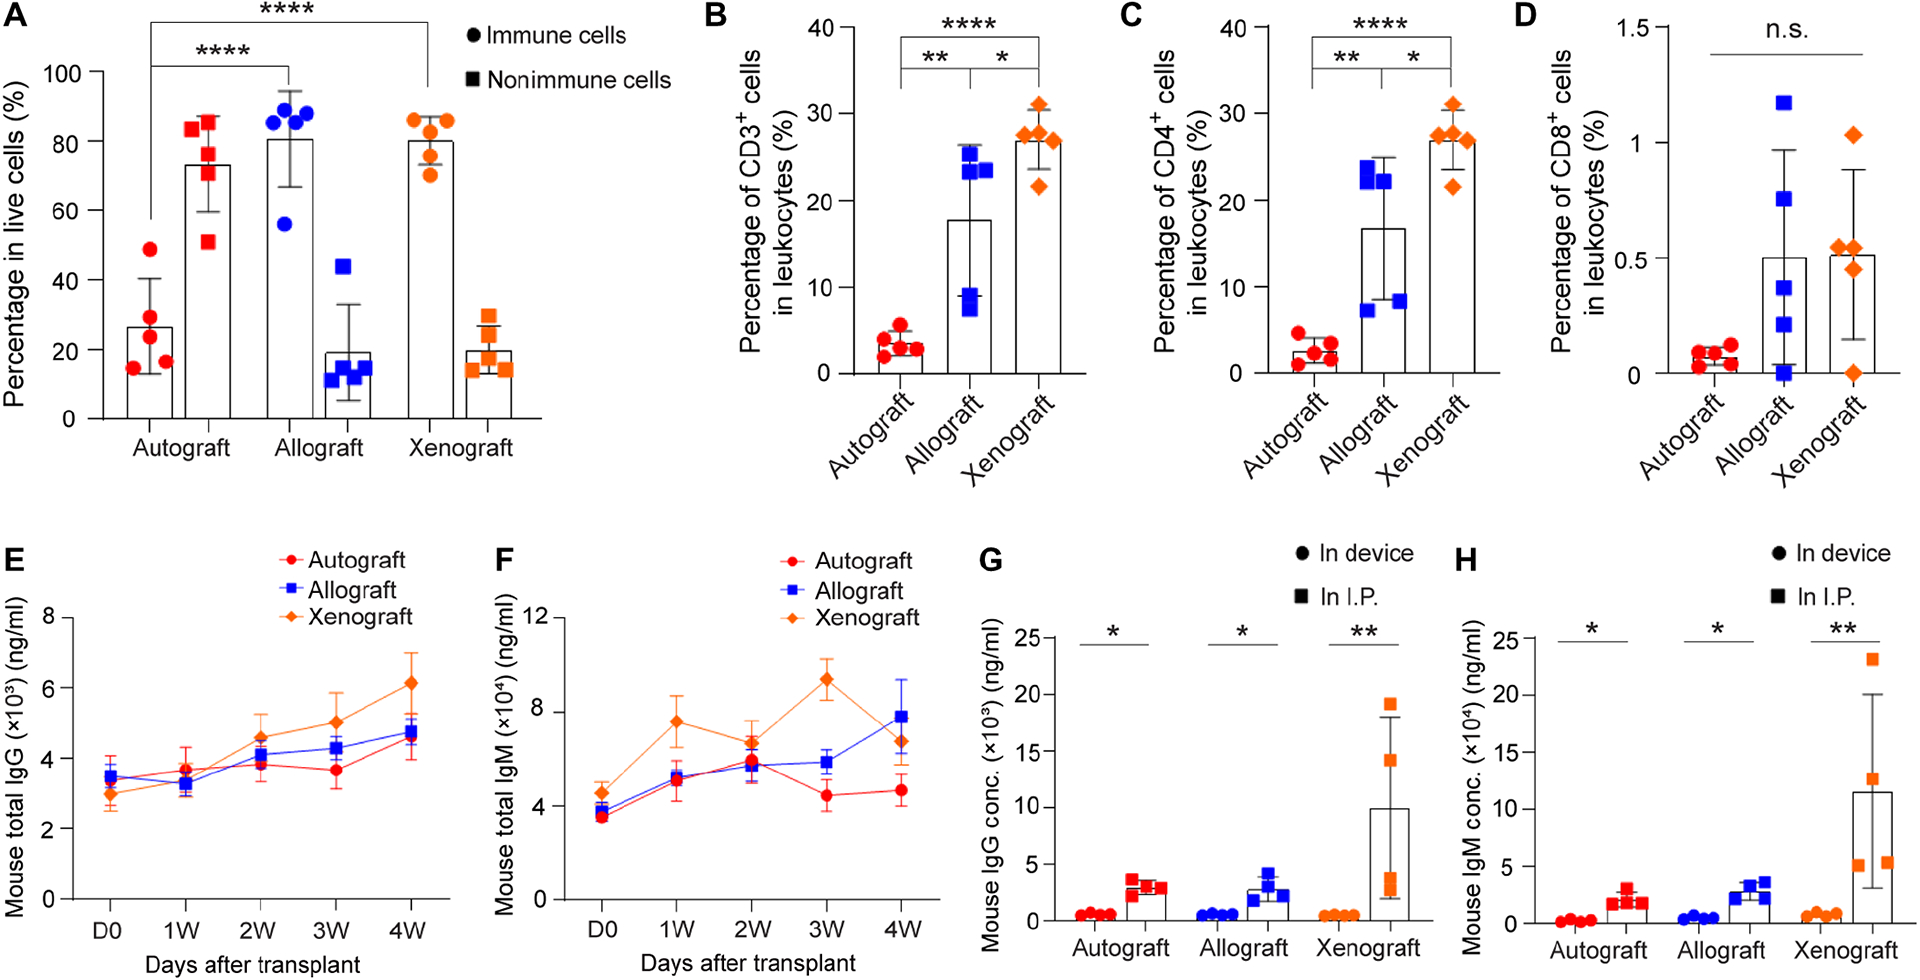
Fig. 5.

Analysis of immune cells in the fibrotic layer around the NICE device (A-D) and antibody levels (E-H) in three different groups: autograft, allograft and xenograft. (A) Percentage of lymphocytes and non-lymphocytes in live cells, mean ± SD (n = 5). (B) Percentage of CD3 positive cells in lymphocytes, mean ± SD (n = 5). (C) Percentage of CD4 positive cells in lymphocytes, mean ± SD (n = 5). (D) Percentage of CD8 positive cells in lymphocytes, mean ± SD (n = 5). (E) Measurement of mouse total IgG in serum extracted from recipients with autografts (red line), allografts (blue line) and xenografts (green line) before transplantation and at 1w, 2w, 3w and 4w post-transplantation, mean ± SD (n = 5). (F) Measurement of mouse total IgM in serum extracted from recipients with autografts (red line), allografts (blue line) and xenografts (green line) before transplantation and at 1w, 2w, 3w and 4w post-transplantation, mean ± SD (n = 5). (G) Measurement of mouse IgG in retrieved device and in I.P. fluid extracted from recipients after device retrieval, mean ± SD (n = 4). (H) Measurement of mouse IgM in retrieved device and in I.P. fluid extracted from recipients after device retrieval, mean ± SD (n = 4). The one-way ANOVA followed by Tukey’s test was performed for comparing the multi-group data. The two-tailed Student’s t-test was performed when the data consisted of only two groups. The level of significance was labeled by n.s., *, ** and ****, denoting non-significant, p value of < 0.05, < 0.01 and < 0.0001, respectively.
