
Fig. 6.
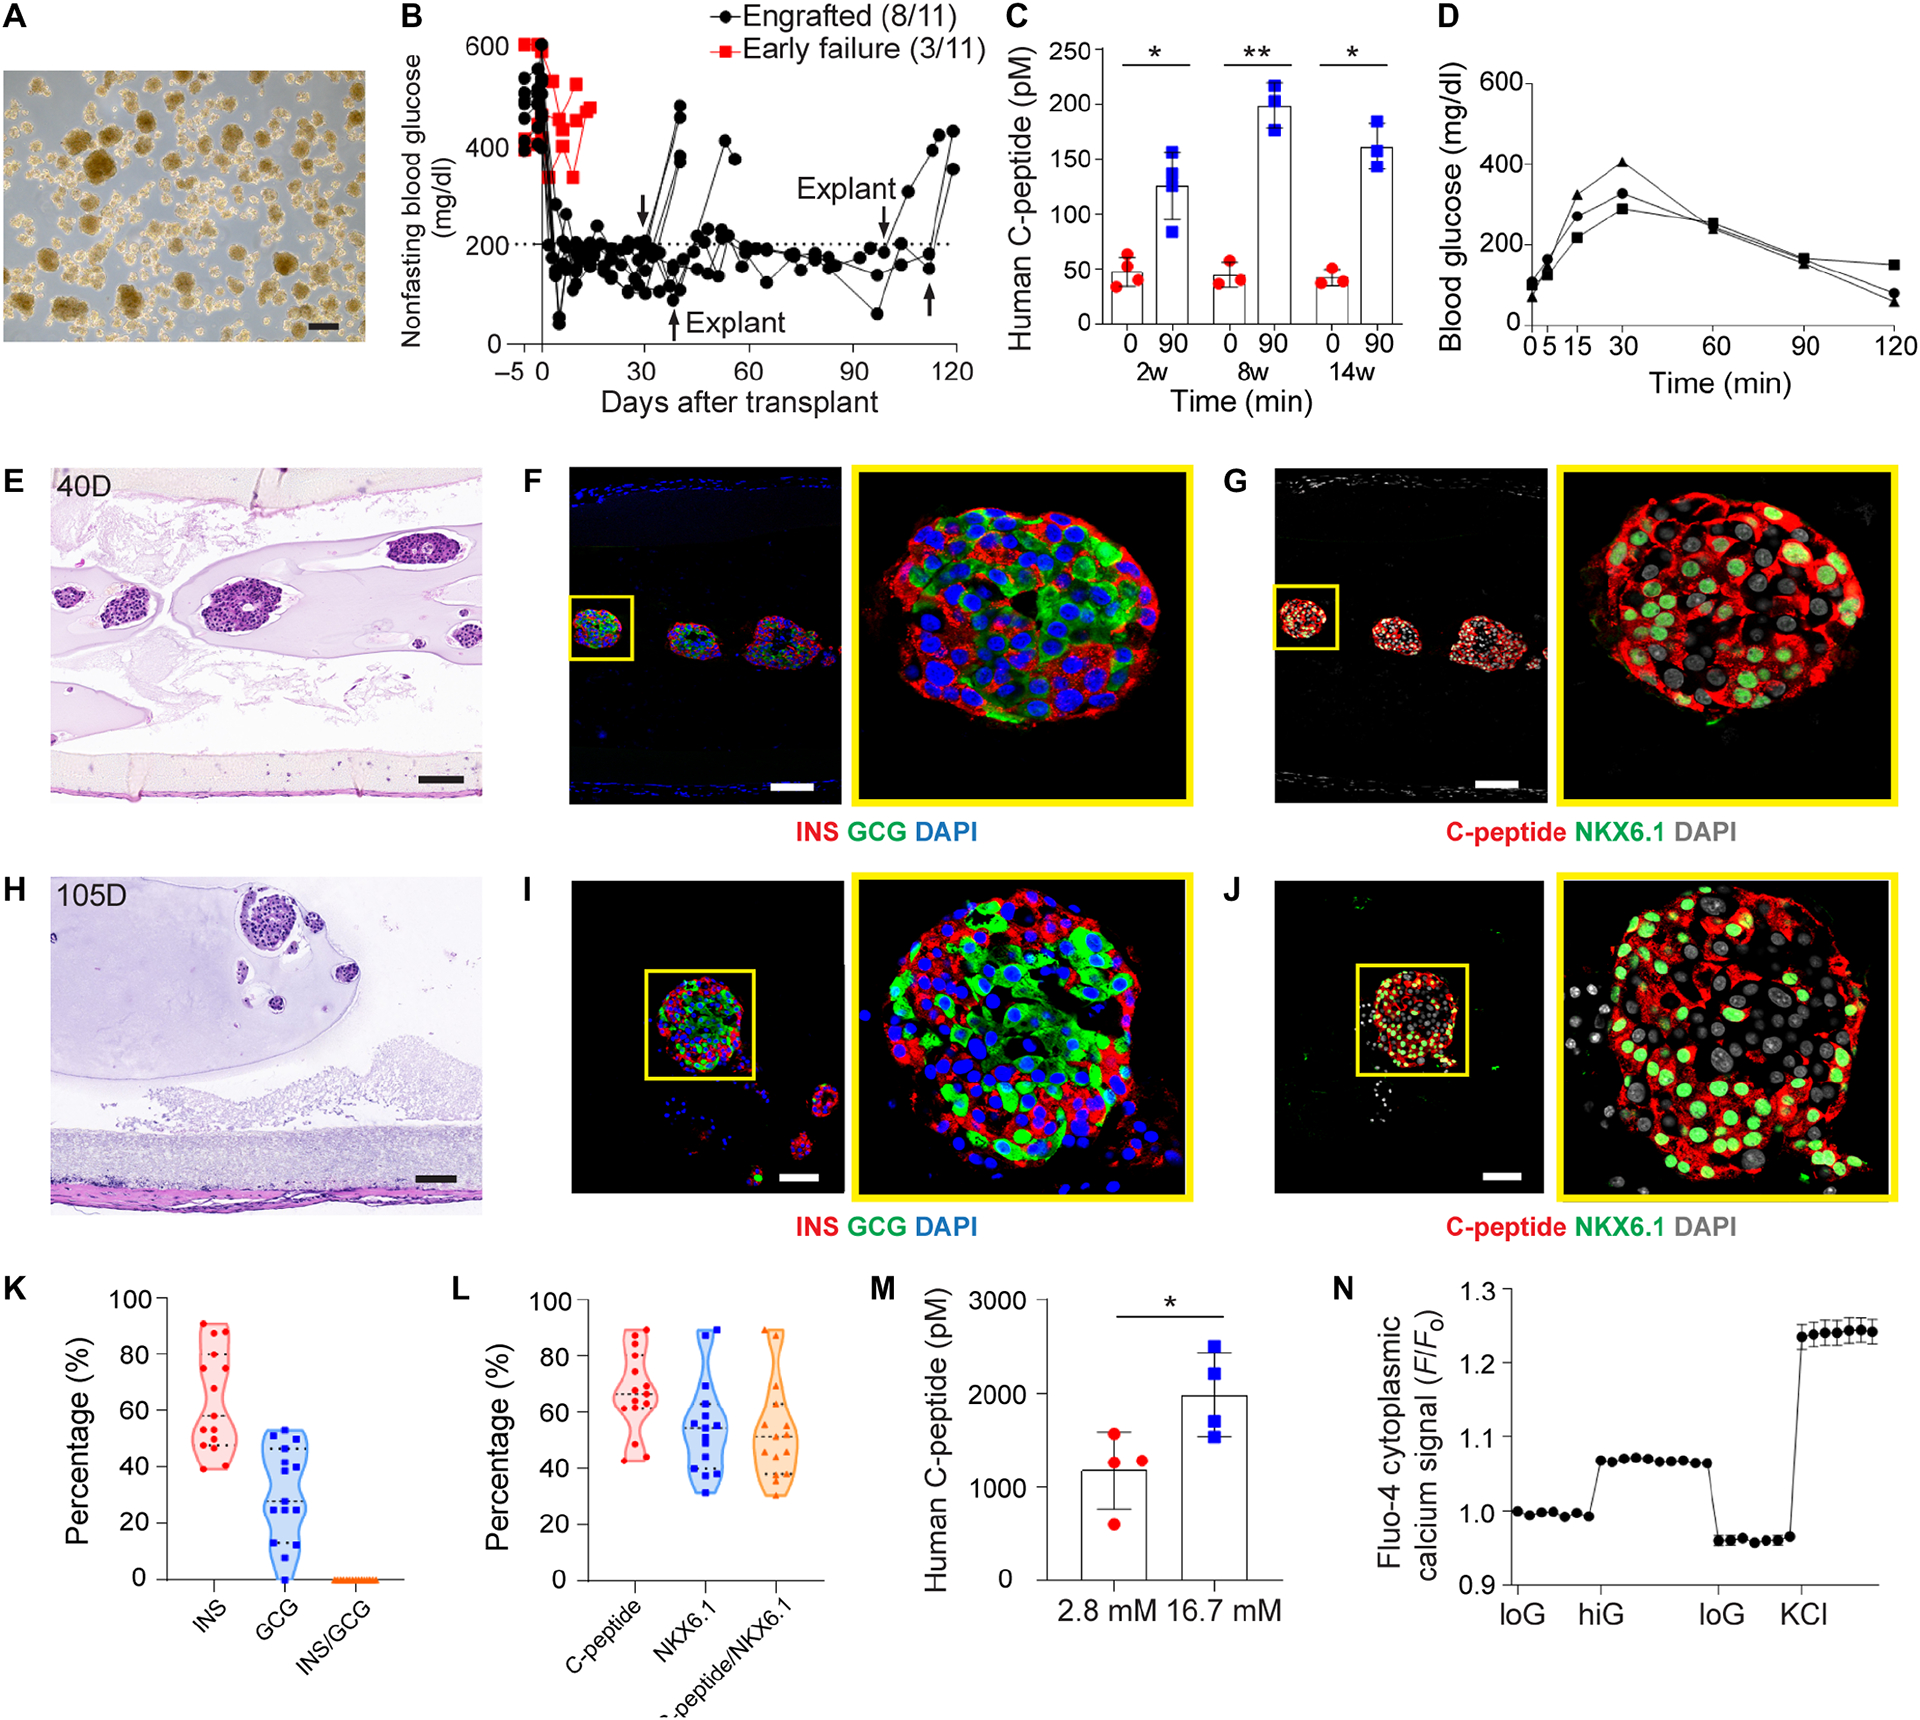
Device function with human islets in diabetic immunodeficient SCID-beige mice. (A) Bright field image of human islets before transplantation. (B) Measurement of non-fasting blood glucose levels (n = 11). Arrows indicate the time points when implants were retrieved from recipients. (C) Measurement of human C-peptide in serum of the mice at 0 min and 90 mins following IPGTT test after 2, 8 and 14 weeks of transplantation, mean ± SD (n = 3–4). (D) Typical blood glucose measurement in IPGTT test of engrafted recipients (week 8). (E-G) H&E staining (E) and immunofluorescent staining (F and G) of human islets from retrieved device after 40 days (higher magnifications on the right). (H-J) H&E staining (H) and immunofluorescent staining (I and J) of human islets from retrieved device after 105 days (higher magnifications on the right). (F and I) Co-immunostaining of insulin (red), glucagon (green) and DAPI (blue). (G and J) Co-immunostaining of C-peptide (red), NKX6.1 (green) and DAPI (gray). (K) Percentage of hormone expressions (insulin, glucagon and insulin/glucagon) quantified from immunofluorescent staining images. One dot represents one islet (n = 15). (L) Percentage of β cell marker expressions (C-peptide, NKX6.1 and C-peptide/NKX6.1) quantified from immunofluorescent staining images. One dot represents one islet (n = 15). (M) Measurement of C-peptide concentration of retrieved devices from engrafted mice following ex vivo glucose stimulation insulin secretion (GSIS) test, mean ± SD (n = 4). (N) Measurements of dynamic normalized Fluo-4 fluorescence intensity for retrieved human islets challenged sequentially with 2, 20, 2 mM glucose and 30 mM KCl, mean ± SD (n = 11). The two-tailed Student’s t-test was performed when the data consisted of two groups. The level of significance was labeled by * and **, denoting the p value of < 0.05 and < 0.01, respectively. Scale bars: 200 μm (A), 100 μm (E-H) and 50 μm (I and J).