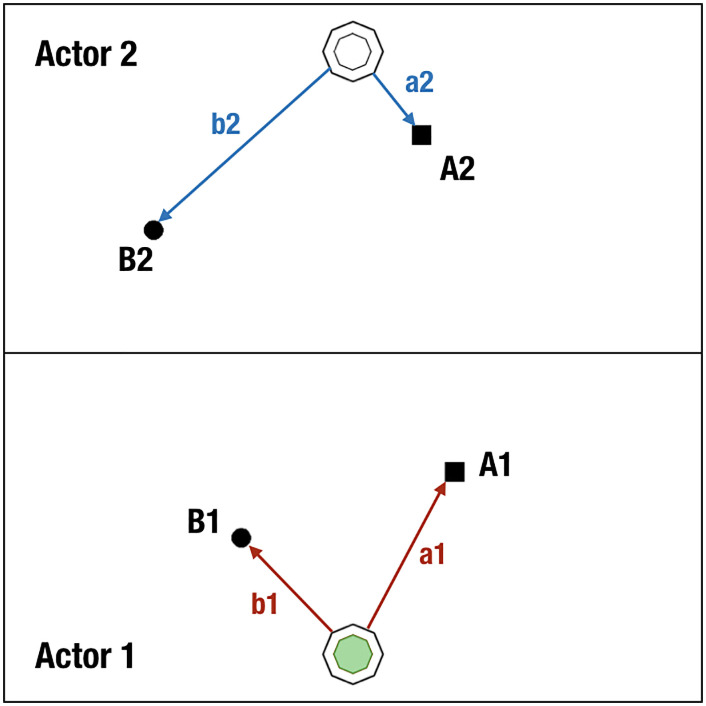
Figure 1. .
An example of the layouts presented to the participants. Starting locations were indicated by the octagons, and the locations of the two pairs of black target objects (circles and squares) were generated by stochastic selection processes. The arrows and labels (not shown to the participants) indicate the distances between the starting locations and the target objects, which provided the basis for cost calculations comparing the two target options.

