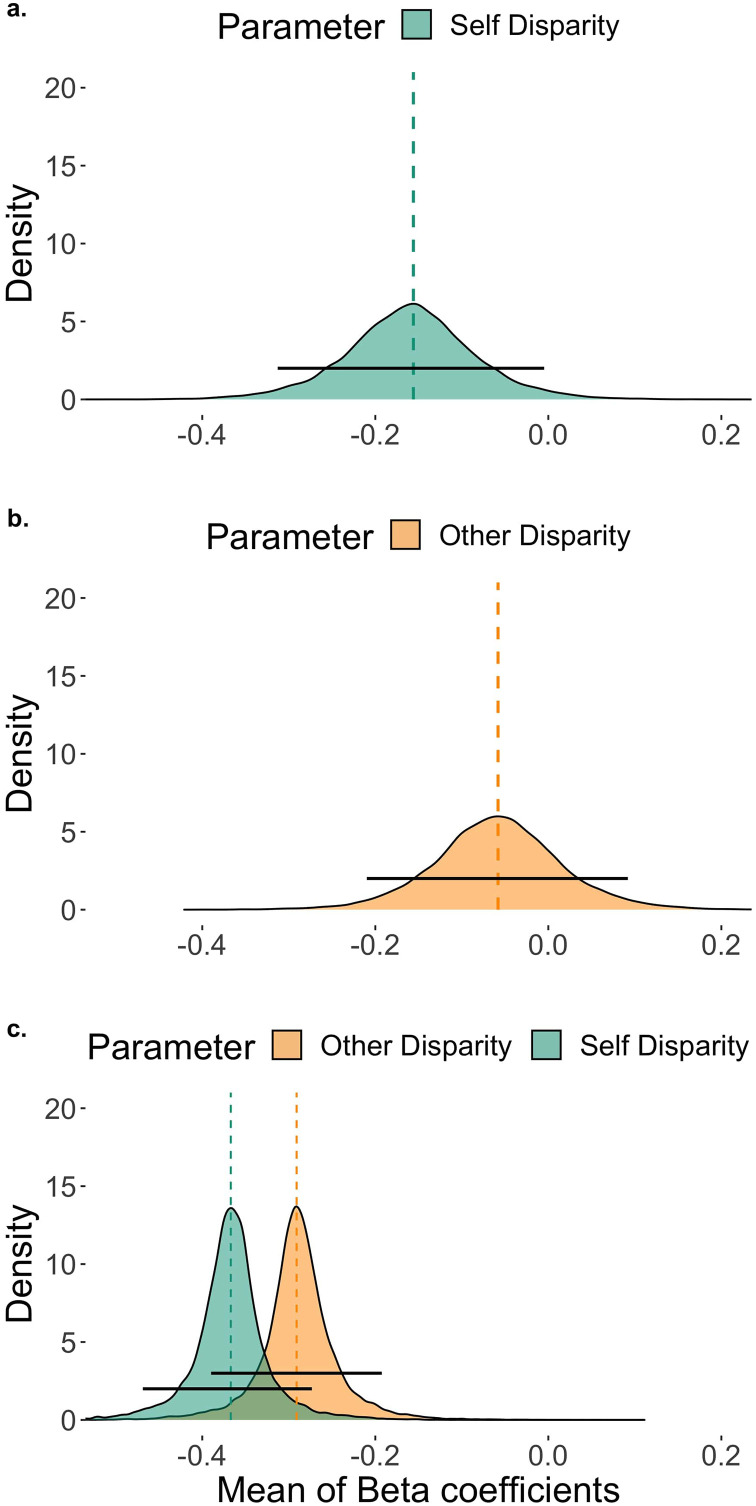
Figure 4. .
Parameter estimates for the Self-, Other-, and Joint-cost minimization models. (a)–(c) Posterior probability distributions of the rescaled μβ parameters for Self and Other Disparities in Models 1 to 3 (see Table 1), respectively. The dashed vertical lines indicate the modes of μβ, the black horizontal lines represent the 95% HDIs (highest density intervals).

