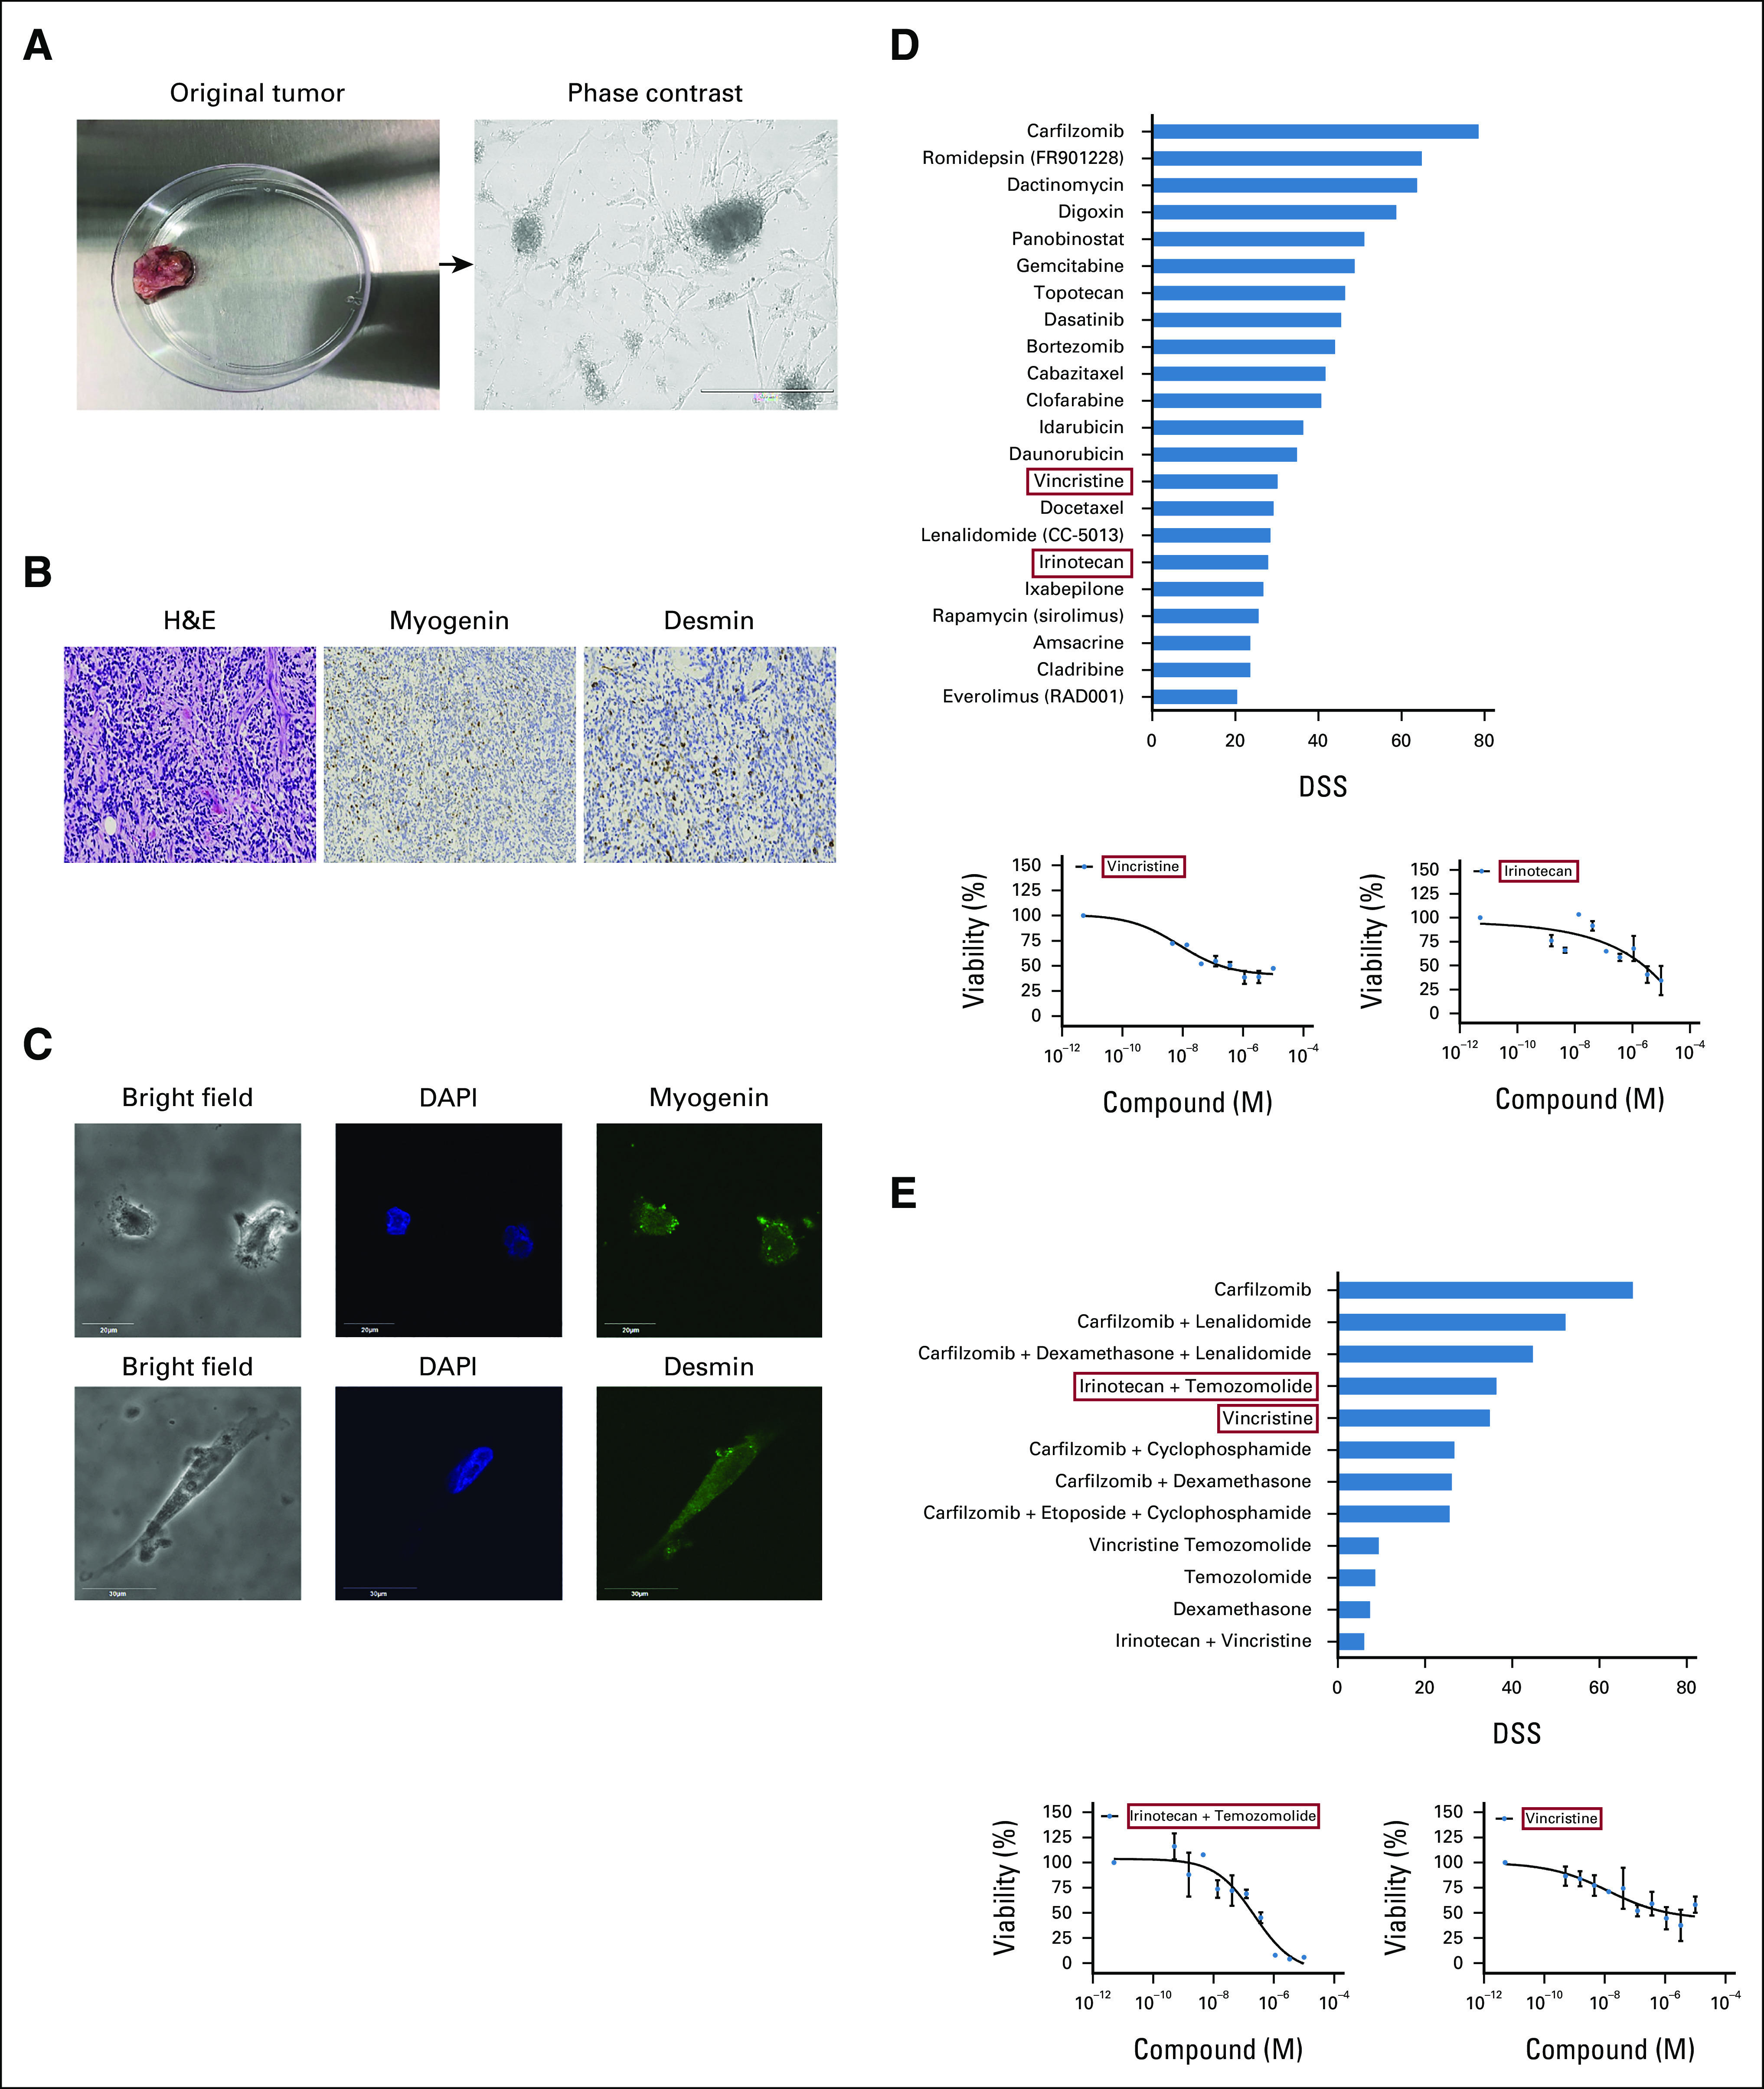
FIG 3.

Ex vivo drug sensitivity results identify top effective drugs for treatment. (A) Representative image of original RMS tumor (left) and patient-derived tumor cells (right) as visualized under light microscope. Scale bars represent 400 µm, magnification 10×. (B) Immunohistochemical staining from the tumor tissue, H&E (left), myogenin (middle), and desmin (right) magnification 100×. (C) Immunofluorescence images show patient-derived cells express RMS markers, myogenin and desmin, scale bar is 20 µm, magnification 144×. (D) Top panel shows graph plot that highlights the most effective and potent drugs on the DST performed. Drugs selected for therapy are highlighted in red boxes. The bottom panel shows dose-response curves of vincristine and irinotecan. (E) The top panel shows most effective combination drugs including irinotecan and temozolomide in combination, as well as vincristine as a single agent (red boxes). The bottom panel shows the dose-response curves of the selected drugs highlighted in red boxes. The patient treatment regimen was modified based on DST results. DAPI, 4’,6-diamidino-2-phenylindole; DSS, drug sensitivity score; DST, drug sensitivity testing; H&E, hematoxylin and eosin; RMS, rhabdomyosarcoma.
