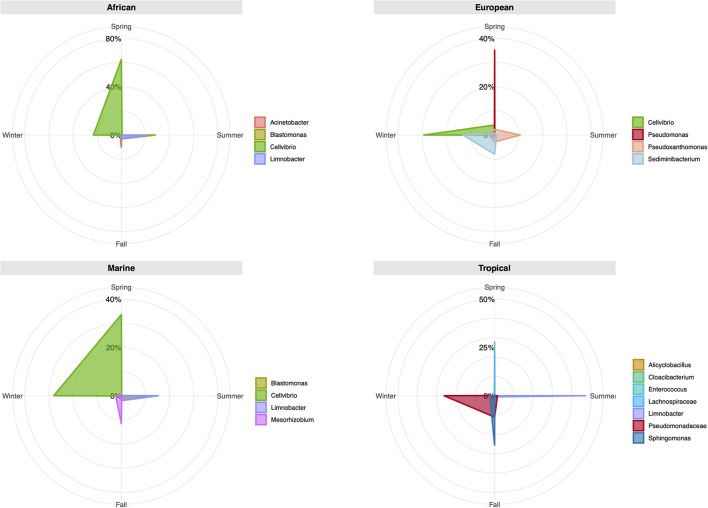
FIGURE 5.
Radar chart presentation of relative operational taxonomic unit (OTU) abundance of taxa at the genus level for different seasons and wind back trajectories. Each chart shows the season levels for the most abundant bacterial genera (>10%). The values along each axis of the radar chart are connected linearly to visualize genera relative abundance as a polygon.

